Accenture (NYSE:ACN) reported financial results for the first quarter of fiscal 2017, ended Nov. 30, 2016, with record net revenues of $8.5 billion, an increase of 6 percent in U.S. dollars and 7 percent in local currency over the same period last year.
This Smart News Release features multimedia. View the full release here: http://www.businesswire.com/news/home/20161221005099/en/
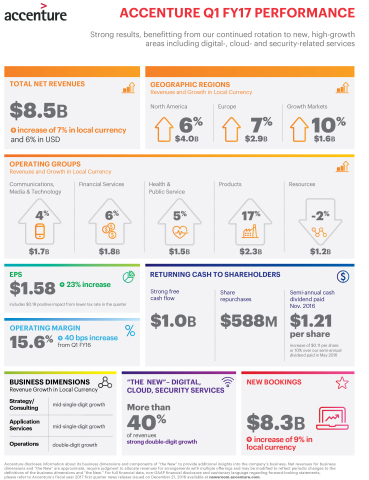
Q1 2017 Earnings Infographic (Graphic: Business Wire)
Diluted earnings per share were $1.58, an increase of $0.30, or 23 percent from the first quarter last year. EPS for the first quarter of fiscal 2017 include an $0.18 positive impact from a lower tax rate for the quarter.
Operating income was $1.33 billion, an increase of 9 percent over the same period last year, and operating margin was 15.6 percent, a year-over-year expansion of 40 basis points.
New bookings for the quarter were $8.3 billion, with consulting bookings of $4.9 billion and outsourcing bookings of $3.4 billion.
Pierre Nanterme, Accenture’s chairman and CEO, said, “We are pleased with our strong financial results for the first quarter. We delivered 7 percent revenue growth in local currency, which was broad-based across the dimensions of our business. We significantly expanded operating margin, delivered very strong earnings per share and free cash flow, and returned nearly $1.4 billion in cash to our shareholders.
“We continue to make significant investments in new and high-growth areas across Accenture – especially digital, cloud and security services, which together now account for more than 40 percent of total revenues and again grew at a very strong double-digit rate in the quarter. With the differentiated, high-value capabilities we are building, we remain confident in our ability to continue driving profitable growth, gaining market share and delivering value for our clients and shareholders.”
Financial Review
Revenues before reimbursements (“net revenues”) for the first quarter of fiscal 2017 were $8.52 billion, compared with $8.01 billion for the first quarter of fiscal 2016, an increase of 6 percent in U.S. dollars and 7 percent in local currency. Net revenues for the quarter reflect a foreign-exchange impact of approximately negative 1 percent, compared with the flat impact we had previously assumed. Adjusting for the actual foreign-exchange impact of negative 1 percent in the quarter, the company’s guided range for quarterly net revenues was approximately $8.32 billion to $8.57 billion. Accenture’s first quarter fiscal 2017 net revenues were in the upper end of this adjusted range.
- Consulting net revenues for the quarter were $4.59 billion, an increase of 6 percent in U.S. dollars and 7 percent in local currency compared with the first quarter of fiscal 2016.
- Outsourcing net revenues were $3.92 billion, an increase of 7 percent in both U.S. dollars and local currency over the first quarter of fiscal 2016.
Diluted EPS for the quarter were $1.58, compared with $1.28 for the first quarter last year. The $0.30 increase in EPS reflects:
- an $0.11 increase from higher revenue and operating results;
- an $0.18 increase from a lower effective tax rate; and
- a $0.02 increase from a lower share count;
partially offset by
- a $0.01 decrease from higher non-operating expense.
Gross margin (gross profit as a percentage of net revenues) for the quarter was 32.1 percent, compared with 32.0 percent for the first quarter last year. Selling, general and administrative (SG&A) expenses for the quarter were $1.40 billion, or 16.4 percent of net revenues, compared with $1.34 billion, or 16.7 percent of net revenues, for the first quarter last year.
Operating income for the quarter increased 9 percent, to $1.33 billion, or 15.6 percent of net revenues, compared with $1.22 billion, or 15.2 percent of net revenues, for the first quarter of fiscal 2016.
The company’s effective tax rate for the quarter was 20.4 percent, compared with 29.3 percent for the first quarter last year. The lower effective tax rate was primarily due to higher benefits from adjustments to prior-year taxes and recognition of excess tax benefits from share-based payments as a result of the adoption of Accounting Standards Update No. 2016-09.
Net income for the quarter was $1.06 billion, a 22 percent increase from $869 million for the first quarter last year.
Operating cash flow for the quarter was $1.08 billion, and property and equipment additions were $85 million. Free cash flow, defined as operating cash flow net of property and equipment additions, was $1.00 billion. For the same period last year, operating cash flow was $643 million; property and equipment additions were $95 million; and free cash flow was $548 million.
Days services outstanding, or DSOs, were 44 days at Nov. 30, 2016, compared with 39 days at Aug. 31, 2016 and 41 days at Nov. 30, 2015.
Accenture’s total cash balance at Nov. 30, 2016 was $4.1 billion, compared with $4.9 billion at Aug. 31, 2016.
New Bookings
New bookings for the first quarter were $8.3 billion and reflect a negative 1 percent foreign-currency impact compared with new bookings in the first quarter last year.
- Consulting new bookings were $4.9 billion, or 59 percent of total new bookings.
- Outsourcing new bookings were $3.4 billion, or 41 percent of total new bookings.
Net Revenues by Operating Group
Net revenues by operating group were as follows:
- Communications, Media & Technology: $1.69 billion, compared with $1.60 billion for the first quarter of fiscal 2016, an increase of 5 percent in U.S. dollars and 4 percent in local currency.
- Financial Services: $1.81 billion, compared with $1.75 billion for the first quarter of fiscal 2016, an increase of 4 percent in U.S. dollars and 6 percent in local currency.
- Health & Public Service: $1.50 billion, compared with $1.42 billion for the first quarter of fiscal 2016, an increase of 5 percent in both U.S. dollars and in local currency.
- Products: $2.32 billion, compared with $1.99 billion for the first quarter of fiscal 2016, an increase of 17 percent in both U.S. dollars and local currency.
- Resources: $1.19 billion, compared with $1.25 billion for the first quarter of fiscal 2016, a decrease of 4 percent in U.S. dollars and 2 percent in local currency.
Net Revenues by Geographic Region
Net revenues by geographic region were as follows:
- North America: $3.98 billion, compared with $3.76 billion for the first quarter of fiscal 2016, an increase of 6 percent in both U.S. dollars and local currency.
- Europe: $2.94 billion, compared with $2.88 billion for the first quarter of fiscal 2016, an increase of 2 percent in U.S. dollars and 7 percent in local currency.
- Growth Markets: $1.59 billion, compared with $1.36 billion for the first quarter of fiscal 2016, an increase of 17 percent in U.S. dollars and 10 percent in local currency.
Returning Cash to Shareholders
Accenture continues to return cash to shareholders through cash dividends and share repurchases.
Dividend
On Nov. 15, 2016, a semi-annual cash dividend of $1.21 per share was paid to Accenture plc Class A ordinary shareholders of record at the close of business on Oct. 21, 2016 and to Accenture Holdings plc ordinary shareholders of record at the close of business on Oct. 18, 2016. These cash dividend payments totaled $785 million. This dividend represents an increase of $0.11 per share, or 10 percent, over the company’s previous semi-annual dividend, declared in March.
Share Repurchase Activity
During the first quarter of fiscal 2017, Accenture repurchased or redeemed 5.0 million shares for a total of $588 million, including approximately 3.9 million shares repurchased in the open market.
Accenture’s total remaining share repurchase authority at Nov. 30, 2016 was approximately $4.9 billion.
At Nov. 30, 2016, Accenture had approximately 649 million total shares outstanding, including 621 million Accenture plc Class A ordinary shares and minority holdings of 28 million shares (Accenture Holdings plc ordinary shares and Accenture Canada Holdings Inc. exchangeable shares).
Business Outlook
Second Quarter Fiscal 2017
Accenture expects net revenues for the second quarter of fiscal 2017 to be in the range of $8.15 billion to $8.40 billion, 5 percent to 8 percent growth in local currency, reflecting the company’s assumption of a negative 2 percent foreign-exchange impact compared with the second quarter of fiscal 2016.
Fiscal Year 2017
Accenture’s business outlook for the full 2017 fiscal year now assumes that the foreign-exchange impact on its results in U.S. dollars will be negative 2 percent compared with fiscal 2016; the company previously expected a flat foreign-exchange impact.
For fiscal 2017, the company continues to expect net revenue growth to be in the range of 5 percent to 8 percent in local currency. The company now expects GAAP diluted EPS to be in the range of $5.64 to $5.87, compared with $5.75 to $5.98 previously, reflecting its updated foreign-exchange assumption.
Accenture continues to expect operating margin for the full fiscal year to be in the range of 14.7 percent to 14.9 percent, an expansion of 10 to 30 basis points from fiscal 2016.
For fiscal 2017, the company continues to expect operating cash flow to be in the range of $4.6 billion to $4.9 billion; property and equipment additions to be $600 million; and free cash flow to be in the range of $4.0 billion to $4.3 billion.
The company continues to expect its annual effective tax rate to be in the range of 22 percent to 24 percent.
Conference Call and Webcast Details
Accenture will host a conference call at 8:00 a.m. EST today to discuss its first-quarter financial results. To participate, please dial +1 (800) 553-0273 [+1 (612) 332-0819 outside the United States, Puerto Rico and Canada] approximately 15 minutes before the scheduled start of the call. The conference call will also be accessible live on the Investor Relations section of the Accenture Web site at www.accenture.com.
A replay of the conference call will be available online at www.accenture.com beginning at 10:30 a.m. EST today, Wednesday, Dec. 21, and continuing until Thursday, Mar. 23, 2017. A podcast of the conference call will be available online at www.accenture.com beginning approximately 24 hours after the call and continuing until Thursday, Mar. 23, 2017. The replay will also be available via telephone by dialing +1 (800) 475-6701 [+1 (320) 365-3844 outside the United States, Puerto Rico and Canada] and entering access code 405525 from 10:30 a.m. EST Wednesday, Dec. 21 through Thursday, Mar. 23, 2017.
About Accenture
Accenture is a leading global professional services company, providing a broad range of services and solutions in strategy, consulting, digital, technology and operations. Combining unmatched experience and specialized skills across more than 40 industries and all business functions – underpinned by the world’s largest delivery network – Accenture works at the intersection of business and technology to help clients improve their performance and create sustainable value for their stakeholders. With more than 394,000 people serving clients in more than 120 countries, Accenture drives innovation to improve the way the world works and lives. Visit us at www.accenture.com.
Non-GAAP Financial Information
This news release includes certain non-GAAP financial information as defined by Securities and Exchange Commission Regulation G. Pursuant to the requirements of this regulation, reconciliations of this non-GAAP financial information to Accenture’s financial statements as prepared under generally accepted accounting principles (GAAP) are included in this press release. Financial results “in local currency” are calculated by restating current-period activity into U.S. dollars using the comparable prior-year period’s foreign-currency exchange rates. Accenture’s management believes providing investors with this information gives additional insights into Accenture’s results of operations. While Accenture’s management believes that the non-GAAP financial measures herein are useful in evaluating Accenture’s operations, this information should be considered as supplemental in nature and not as a substitute for the related financial information prepared in accordance with GAAP.
Forward-Looking Statements
Except for the historical information and discussions contained herein, statements in this news release may constitute forward-looking statements within the meaning of the Private Securities Litigation Reform Act of 1995. Words such as “may,” “will,” “should,” “likely,” “anticipates,” “expects,” “intends,” “plans,” “projects,” “believes,” “estimates,” “positioned,” “outlook” and similar expressions are used to identify these forward-looking statements. These statements involve a number of risks, uncertainties and other factors that could cause actual results to differ materially from those expressed or implied. These include, without limitation, risks that: the company’s results of operations could be adversely affected by volatile, negative or uncertain economic conditions and the effects of these conditions on the company’s clients’ businesses and levels of business activity; the company’s business depends on generating and maintaining ongoing, profitable client demand for the company’s services and solutions, including through the adaptation and expansion of its services and solutions in response to ongoing changes in technology and offerings, and a significant reduction in such demand or an inability to respond to the changing technological environment could materially affect the company’s results of operations; if the company is unable to keep its supply of skills and resources in balance with client demand around the world and attract and retain professionals with strong leadership skills, the company’s business, the utilization rate of the company’s professionals and the company’s results of operations may be materially adversely affected; the markets in which the company competes are highly competitive, and the company might not be able to compete effectively; the company could have liability or the company’s reputation could be damaged if the company fails to protect client and/or company data from security breaches or cyberattacks; the company’s profitability could materially suffer if the company is unable to obtain favorable pricing for its services and solutions, if the company is unable to remain competitive, if its cost-management strategies are unsuccessful or if it experiences delivery inefficiencies; changes in the company’s level of taxes, as well as audits, investigations and tax proceedings, or changes in tax laws or in their interpretation or enforcement, could have a material adverse effect on the company’s effective tax rate, results of operations, cash flows and financial condition; the company’s results of operations could be materially adversely affected by fluctuations in foreign currency exchange rates; the company’s business could be materially adversely affected if the company incurs legal liability; the company’s work with government clients exposes the company to additional risks inherent in the government contracting environment; the company might not be successful at identifying, acquiring, investing in or integrating businesses, entering into joint ventures or divesting businesses; the company’s Global Delivery Network is increasingly concentrated in India and the Philippines, which may expose it to operational risks; as a result of the company’s geographically diverse operations and its growth strategy to continue geographic expansion, the company is more susceptible to certain risks; adverse changes to the company’s relationships with key alliance partners or in the business of its key alliance partners could adversely affect the company’s results of operations; the company’s services or solutions could infringe upon the intellectual property rights of others or the company might lose its ability to utilize the intellectual property of others; if the company is unable to protect its intellectual property rights from unauthorized use or infringement by third parties, its business could be adversely affected; the company’s ability to attract and retain business and employees may depend on its reputation in the marketplace; if the company is unable to manage the organizational challenges associated with its size, the company might be unable to achieve its business objectives; any changes to the estimates and assumptions that the company makes in connection with the preparation of its consolidated financial statements could adversely affect its financial results; many of the company’s contracts include payments that link some of its fees to the attainment of performance or business targets and/or require the company to meet specific service levels, which could increase the variability of the company’s revenues and impact its margins; the company’s results of operations and share price could be adversely affected if it is unable to maintain effective internal controls; the company may be subject to criticism and negative publicity related to its incorporation in Ireland; as well as the risks, uncertainties and other factors discussed under the “Risk Factors” heading in Accenture plc’s most recent annual report on Form 10-K and other documents filed with or furnished to the Securities and Exchange Commission. Statements in this news release speak only as of the date they were made, and Accenture undertakes no duty to update any forward-looking statements made in this news release or to conform such statements to actual results or changes in Accenture’s expectations.
ACCENTURE PLC
CONSOLIDATED INCOME STATEMENTS (In thousands of U.S. dollars, except share and per share amounts) (Unaudited) | ||||||||||||||
| Three Months Ended | ||||||||||||||
|
November 30, 2016 |
% of Net | November 30, 2015 |
% of Net | |||||||||||
| REVENUES: | ||||||||||||||
| Revenues before reimbursements (“Net revenues”) | $ | 8,515,517 | 100% | $ | 8,013,163 | 100% | ||||||||
| Reimbursements | 490,086 | 452,821 | ||||||||||||
| Revenues | 9,005,603 | 8,465,984 | ||||||||||||
| OPERATING EXPENSES: | ||||||||||||||
| Cost of services: | ||||||||||||||
| Cost of services before reimbursable expenses | 5,785,485 | 67.9% | 5,450,644 | 68.0% | ||||||||||
| Reimbursable expenses | 490,086 | 452,821 | ||||||||||||
| Cost of services | 6,275,571 | 5,903,465 | ||||||||||||
| Sales and marketing | 888,827 | 10.4% | 875,793 | 10.9% | ||||||||||
| General and administrative costs | 509,246 | 6.0% | 465,466 | 5.8% | ||||||||||
| Total operating expenses | 7,673,644 | 7,244,724 | ||||||||||||
| OPERATING INCOME | 1,331,959 | 15.6% | 1,221,260 | 15.2% | ||||||||||
| Interest income | 8,297 | 7,126 | ||||||||||||
| Interest expense | (3,048 | ) | (4,052 | ) | ||||||||||
| Other income (expense), net | (6,087 | ) | 4,029 | |||||||||||
| INCOME BEFORE INCOME TAXES | 1,331,121 | 15.6% | 1,228,363 | 15.3% | ||||||||||
| Provision for income taxes | 271,372 | 359,682 | ||||||||||||
| NET INCOME | 1,059,749 | 12.4% | 868,681 | 10.8% | ||||||||||
Net income attributable to noncontrolling interests in Accenture | (46,452 | ) | (39,576 | ) | ||||||||||
| Net income attributable to noncontrolling interests – other (1) | (8,821 | ) | (10,206 | ) | ||||||||||
| NET INCOME ATTRIBUTABLE TO ACCENTURE PLC | $ | 1,004,476 | 11.8% | $ | 818,899 | 10.2% | ||||||||
| CALCULATION OF EARNINGS PER SHARE: | ||||||||||||||
| Net income attributable to Accenture plc | $ | 1,004,476 | $ | 818,899 | ||||||||||
Net income attributable to noncontrolling interests in Accenture | 46,452 | 39,576 | ||||||||||||
| Net income for diluted earnings per share calculation | $ | 1,050,928 | $ | 858,475 | ||||||||||
| EARNINGS PER SHARE: | ||||||||||||||
| -Basic | $ | 1.62 | $ | 1.31 | ||||||||||
| -Diluted | $ | 1.58 | $ | 1.28 | ||||||||||
| WEIGHTED AVERAGE SHARES: | ||||||||||||||
| -Basic | 621,569,764 | 626,463,124 | ||||||||||||
| -Diluted | 663,752,830 | 671,300,744 | ||||||||||||
| Cash dividends per share | $ | 1.21 | $ | 1.10 | ||||||||||
_______________ | |||
| (1) | Comprised primarily of noncontrolling interest attributable to the noncontrolling shareholders of Avanade, Inc. | ||
| (2) | Diluted earnings per share assumes the redemption of all Accenture Holdings plc ordinary shares owned by holders of noncontrolling interests and the exchange of all Accenture Canada Holdings Inc. exchangeable shares for Accenture plc Class A ordinary shares on a one-for-one basis. The income effect does not take into account “Net income attributable to noncontrolling interests — other,” since those shares are not redeemable or exchangeable for Accenture plc Class A ordinary shares. | ||
ACCENTURE PLC
SUMMARY OF REVENUES (In thousands of U.S. dollars) (Unaudited) | ||||||||||||||
| Percent Increase (Decrease) U.S. dollars | Percent Increase (Decrease) Local Currency | |||||||||||||
| Three Months Ended | ||||||||||||||
November 30, 2016 | November 30, 2015 | |||||||||||||
| OPERATING GROUPS | ||||||||||||||
| Communications, Media & Technology | $ | 1,686,196 | $ | 1,604,639 | 5 | % | 4 | % | ||||||
| Financial Services | 1,809,769 | 1,745,216 | 4 | 6 | ||||||||||
| Health & Public Service | 1,500,774 | 1,423,867 | 5 | 5 | ||||||||||
| Products | 2,320,169 | 1,990,123 | 17 | 17 | ||||||||||
| Resources | 1,194,858 | 1,245,084 | (4 | ) | (2 | ) | ||||||||
| Other | 3,751 | 4,234 | n/m | n/m | ||||||||||
| TOTAL Net Revenues | 8,515,517 | 8,013,163 | 6 | % | 7 | % | ||||||||
| Reimbursements | 490,086 | 452,821 | 8 | |||||||||||
| TOTAL REVENUES | $ | 9,005,603 | $ | 8,465,984 | 6 | % | ||||||||
| GEOGRAPHY | ||||||||||||||
| North America | $ | 3,981,075 | $ | 3,763,469 | 6 | % | 6 | % | ||||||
| Europe | 2,941,802 | 2,884,748 | 2 | 7 | ||||||||||
| Growth Markets | 1,592,640 | 1,364,946 | 17 | 10 | ||||||||||
| TOTAL Net Revenues | $ | 8,515,517 | $ | 8,013,163 | 6 | % | 7 | % | ||||||
| TYPE OF WORK | ||||||||||||||
| Consulting | $ | 4,593,019 | $ | 4,346,054 | 6 | % | 7 | % | ||||||
| Outsourcing | 3,922,498 | 3,667,109 | 7 | 7 | ||||||||||
| TOTAL Net Revenues | $ | 8,515,517 | $ | 8,013,163 | 6 | % | 7 | % | ||||||
_________ n/m = not meaningful | ||||||||||||||
OPERATING INCOME BY OPERATING GROUP (In thousands of U.S. dollars) (Unaudited) | |||||||||||||||||
| Three Months Ended | |||||||||||||||||
| November 30, 2016 | November 30, 2015 | ||||||||||||||||
|
Operating Income | Operating Margin |
Operating Income | Operating Margin |
Increase (Decrease) | |||||||||||||
| Communications, Media & Technology | $ | 257,844 | 15% | $ | 247,873 | 15% | $ | 9,971 | |||||||||
| Financial Services | 319,489 | 18 | 322,785 | 18 | (3,296 | ) | |||||||||||
| Health & Public Service | 199,227 | 13 | 172,578 | 12 | 26,649 | ||||||||||||
| Products | 408,699 | 18 | 291,223 | 15 | 117,476 | ||||||||||||
| Resources | 146,700 | 12 | 186,801 | 15 | (40,101 | ) | |||||||||||
| Total | $ | 1,331,959 | 15.6% | $ | 1,221,260 | 15.2% | $ | 110,699 | |||||||||
ACCENTURE PLC
CONSOLIDATED BALANCE SHEETS (In thousands of U.S. dollars) | |||||||||
| November 30, 2016 | August 31, 2016 | ||||||||
| (Unaudited) | |||||||||
| ASSETS | |||||||||
| CURRENT ASSETS: | |||||||||
| Cash and cash equivalents | $ | 4,077,058 | $ | 4,905,609 | |||||
| Short-term investments | 2,511 | 2,875 | |||||||
| Receivables from clients, net | 4,298,605 | 4,072,180 | |||||||
| Unbilled services, net | 2,170,403 | 2,150,219 | |||||||
| Other current assets | 819,829 | 845,339 | |||||||
| Total current assets | 11,368,406 | 11,976,222 | |||||||
| NON-CURRENT ASSETS: | |||||||||
| Unbilled services, net | 51,370 | 68,145 | |||||||
| Investments | 239,470 | 198,633 | |||||||
| Property and equipment, net | 928,900 | 956,542 | |||||||
| Goodwill | 4,008,760 | 3,609,437 | |||||||
| Other non-current assets | 3,846,835 | 3,800,025 | |||||||
| Total non-current assets | 9,075,335 | 8,632,782 | |||||||
| TOTAL ASSETS | $ | 20,443,741 | $ | 20,609,004 | |||||
| LIABILITIES AND SHAREHOLDERS’ EQUITY | |||||||||
| CURRENT LIABILITIES: | |||||||||
| Current portion of long-term debt and bank borrowings | $ | 2,773 | $ | 2,773 | |||||
| Accounts payable | 1,163,348 | 1,280,821 | |||||||
| Deferred revenues | 2,079,897 | 2,364,728 | |||||||
| Accrued payroll and related benefits | 4,461,239 | 4,040,751 | |||||||
| Other accrued liabilities | 1,462,825 | 1,189,851 | |||||||
| Total current liabilities | 9,170,082 | 8,878,924 | |||||||
| NON-CURRENT LIABILITIES: | |||||||||
| Long-term debt | 24,562 | 24,457 | |||||||
| Other non-current liabilities | 3,214,946 | 3,516,247 | |||||||
| Total non-current liabilities | 3,239,508 | 3,540,704 | |||||||
| TOTAL ACCENTURE PLC SHAREHOLDERS’ EQUITY | 7,417,093 | 7,555,262 | |||||||
| NONCONTROLLING INTERESTS | 617,058 | 634,114 | |||||||
| TOTAL SHAREHOLDERS’ EQUITY | 8,034,151 | 8,189,376 | |||||||
| TOTAL LIABILITIES AND SHAREHOLDERS’ EQUITY | $ | 20,443,741 | $ | 20,609,004 | |||||
ACCENTURE PLC
CONSOLIDATED CASH FLOWS STATEMENTS (In thousands of U.S. dollars) (Unaudited) | |||||||||||
| Three Months Ended | |||||||||||
November 30, |
November 30, | ||||||||||
| CASH FLOWS FROM OPERATING ACTIVITIES: | |||||||||||
| Net income | $ | 1,059,749 | $ | 868,681 | |||||||
| Depreciation, amortization and asset impairments | 187,433 | 181,882 | |||||||||
| Share-based compensation expense | 149,796 | 129,183 | |||||||||
| Change in assets and liabilities/other, net | (313,096 | ) | (536,489 | ) | |||||||
| Net cash provided by (used in) operating activities | 1,083,882 | 643,257 | |||||||||
| CASH FLOWS FROM INVESTING ACTIVITIES: | |||||||||||
| Purchases of property and equipment | (84,553 | ) | (94,777 | ) | |||||||
| Purchases of businesses and investments, net of cash acquired | (599,107 | ) | (612,666 | ) | |||||||
| Proceeds from the sale of businesses and investments, net of cash transferred | (7,200 | ) | — | ||||||||
| Other investing, net | 1,238 | 951 | |||||||||
| Net cash provided by (used in) investing activities | (689,622 | ) | (706,492 | ) | |||||||
| CASH FLOWS FROM FINANCING ACTIVITIES: | |||||||||||
| Proceeds from issuance of ordinary shares | 212,711 | 182,285 | |||||||||
| Purchases of shares | (587,935 | ) | (657,811 | ) | |||||||
| Cash dividends paid | (785,127 | ) | (720,676 | ) | |||||||
| Other financing, net | (2,424 | ) | 217 | ||||||||
| Net cash provided by (used in) financing activities | (1,162,775 | ) | (1,195,985 | ) | |||||||
| Effect of exchange rate changes on cash and cash equivalents | (60,036 | ) | (28,353 | ) | |||||||
| NET INCREASE (DECREASE) IN CASH AND CASH EQUIVALENTS | (828,551 | ) | (1,287,573 | ) | |||||||
| CASH AND CASH EQUIVALENTS, beginning of period | 4,905,609 | 4,360,766 | |||||||||
| CASH AND CASH EQUIVALENTS, end of period | $ | 4,077,058 | $ | 3,073,193 | |||||||
View source version on businesswire.com: http://www.businesswire.com/news/home/20161221005099/en/


