 S&P/ASX 200
 Talking Points:
- Index trading below support at 5,500 after a push to the downside
- Price has been trading sideways between 5,500 and 5,570 since the beginning of the month
- Focus might shift to 5,380-5,400 on a hold below 5,500
Showcase your trading skills against your peers in FXCM's $10,000 Monthly Challenge Here, but learn good trading habits with the “Traits of successful traders” series
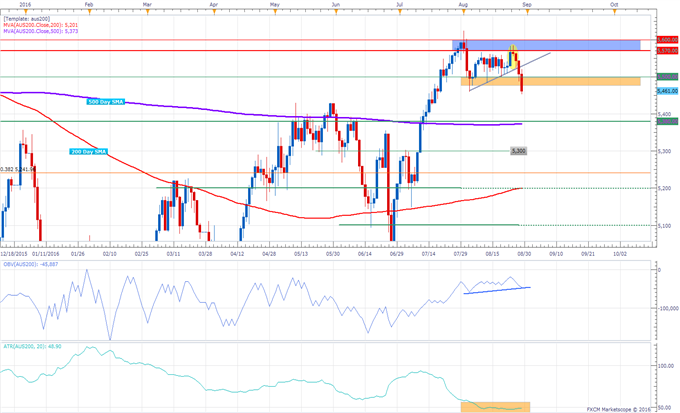
The ASX 200 is trading lower at the time of writing, after the index failed to establish new 2016 highs following a rejection at a resistance area between 5,570 and 5,600.
The Index was trading sideways since the beginning of the month, between the 5,500 support and the 5,600 resistance area, which means that if the tentative break below 5,500 holds, focus might shift to possible support around the 5,380-5,400 area.
This makes the 5,380-5,400 area potentially key for any bullish intentions going forward, as a hold above those levels may still imply that the downside move was corrective, while a break below might be interpreted as a bearish sign.
If the index manages to reverse its current losses, eyes seems likely to be on 5,600 again for potential resistance.
It’s important to note that volatility is still printing its lowest levels since September 2014 (based on a 20-day ATR study).
ASX 200 Daily Chart: August 28, 2016
--- Written by Oded Shimoni, Junior Currency Analyst for DailyFX.com
To contact Oded Shimoni, e-mail oshimoni@dailyfx.com
Follow him on Twitter at @OdedShimoni
original source


