- EURUSD first long term bearish breakout attempt
- AUDUSD follows through on prior week’s reversal
- USDJPY volatile range
--Subscribe to Jamie Saettele's distribution list in order to receive a free report to your inbox thrice a week.
EUR/USD
Weekly
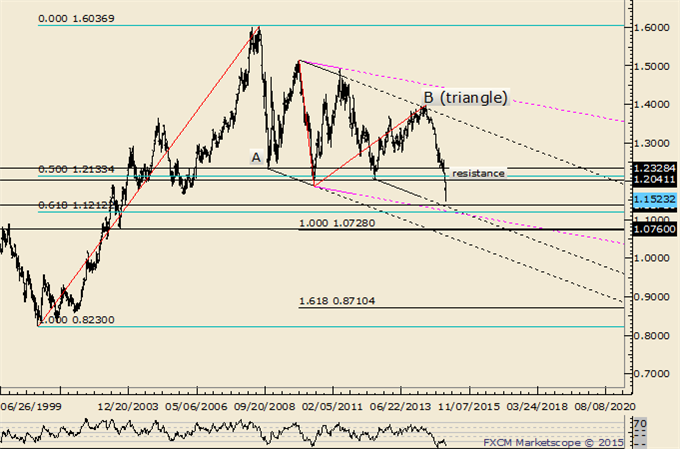
Chart Prepared by Jamie Saettele, CMT using Marketscope 2.0
Automate trades with Mirror Trader
-“BIG picture, monthly RSI has broken out of a triangle pattern. Sometimes, a pattern breakout in momentum (or OBV) precedes the breakout in price. The development’s implications are obviously significant.”
-EURUSD has now taken out the 2012 and 2010 lows. Only the 2005 low remains before ‘free-fall’ territory towards the 61.8% retracement of the rally from the 2000 low near 1.12. Given insanely one sided sentiment for an extended period of time however, this first attempt at the 2005 low may fail and give way to a much needed countertrend move.
-A number of calls for parity have been published recently. While the long term pattern suggests an eventual print near .90, the sudden aggressively bearish calls come just after a record small speculator short position and record open interest in euro futures was recorded in November. The same COT profile was evident in May 2012, before the EURUSD bottomed in July. Aggressive forecasts are often published when it’s comfortable to do so, which means that the trend is embedded in the public consciousness to the point of extremity. The path to .90 or so won’t be smooth (in other words…more 2 way trade). Former support may provide resistance from 1.2040 to 1.2330.
GBP/USD
Weekly
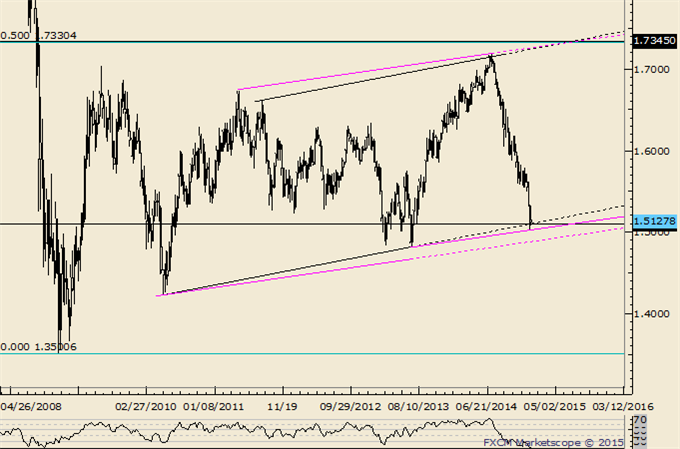
Chart Prepared by Jamie Saettele, CMT using Marketscope 2.0
Automate trades with Mirror Trader
-“A period of congestion may be in order as price has bounced from near the 50% retracement of the advance from the 2013 low but the drop under 1.6050 produces a pivot high on 9/19 and allows one to draw a downward sloping channel.”
-GBPUSD is at a major level in 1.51. Failure to find support here would open up the 2013 low at 1.4812. The gap at 1.5325 could still be of the breakaway variety as the rally stalled prior to the level.
AUD/USD
Weekly
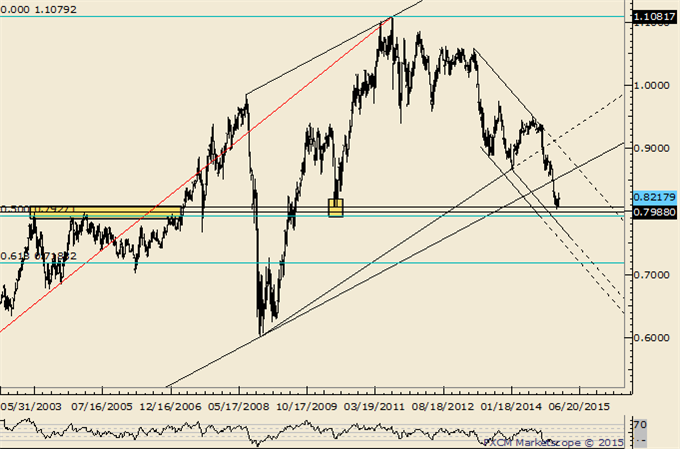
Chart Prepared by Jamie Saettele, CMT using Marketscope 2.0
Automate trades with Mirror Trader
-“AUDUSD was unable to hold a long term parallel. The risk is for lower prices with the May 2010 low at .8067 and the 2005 high at .7986 of interest as supports”.
-“AUDUSD dipped as low as .8031, which is within the .7927-.8067 long term support zone (2010 low to 50% of rally from 2001 low with 2004 and 2005 lows in between). A small range weekly key reversal is present, which may set the stage for a recovery.”
NZD/USD
Weekly
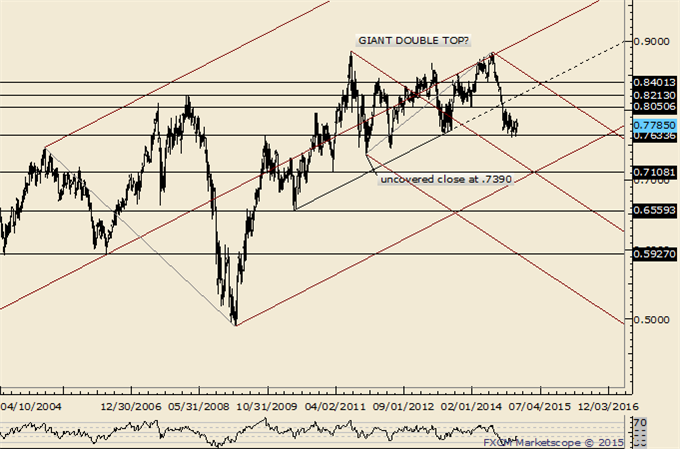
Chart Prepared by Jamie Saettele, CMT using Marketscope 2.0
Automate trades with Mirror Trader
-NZDUSD is bouncing from the October 2009 high but one can’t help but notice that a major double top is possible with a target of .5898. That would trigger on a drop below .7370. Near term, consolidation since September could be taking the form of a triangle or flat.
USD/JPY
Weekly
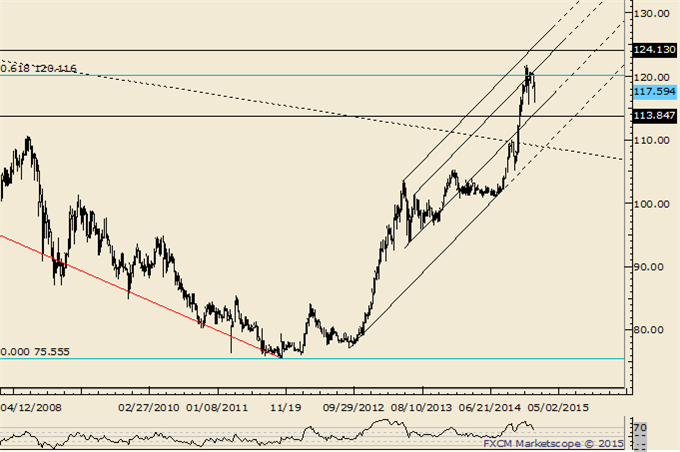
Chart Prepared by Jamie Saettele, CMT using Marketscope 2.0
Automate trades with Mirror Trader
-“USDJPY held up into the New Year and said January decline is underway. A sideways pattern could take hold between roughly 117 and 120.”
-USDJPY dipped under 116 this week but the range described remains intact. Failure to hold range lows could target 110.
USD/CAD
Weekly
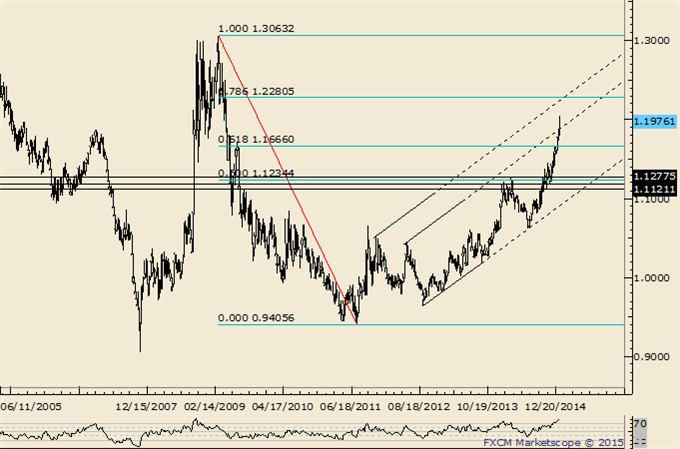
Chart Prepared by Jamie Saettele, CMT using Marketscope 2.0
Automate trades with Mirror Trader
-“USDCAD has propelled higher and is probably headed into upper parallels. Levels of interest on the upside are 1.1666 (Fibonacci) and 1.1723 (June 2009 high).”
-USDCAD took out both mentioned levels and has broken the 2007 high, major upper parallel and 61.8% extension of the 2007-2009 rally from the 2011 low at 1.1882. The market printed over the psychological 1.20 today and closed below. Some long wicks the last few days could indicate a coming pullback but weakness under 1.1800 is needed to suggest as much and shift focus to support at 1.1560.
original source

