To receive Ilya's analysis directly via email, please SIGN UP HERE
Talking Points:
- AUD/USD Technical Strategy: Flat
- Support:0.9278, 0.9242, 0.9223
- Resistance: 0.9305, 0.9348, 0.9383
The Australian Dollar advanced as expected against its US counterpart, confirming the formation of a Falling Wedge chart pattern. Near-term resistance is at 0.9305, the 23.6% Fibonacci retracement, with a break above that on a daily closing basis exposing the 38.2% level at 0.9348. Alternatively, a reversal below the 14.6% Fib at 0.9278 clears the way for a test of 0.9242, the intersection of the broken Wedge top and a rising trend line set from early April. Positive RSI divergence argues in favor of an upside scenario.
The available trading range is too narrow to justify taking a short or a long position at current levels from a risk/reward perspective. We will remain flat for now, waiting for a more attractive opportunity to present itself.
Add these technical levels directly to your charts with our Support/Resistance Wizard app!
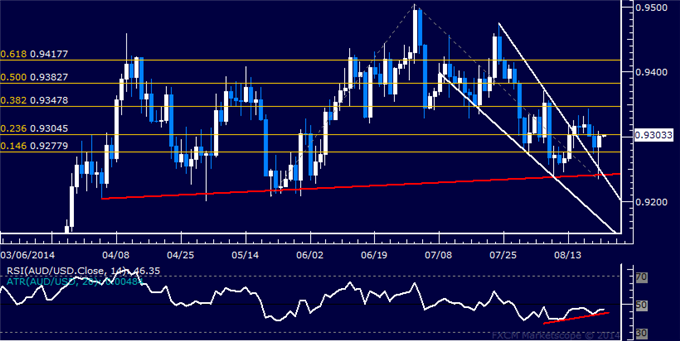
Daily Chart - Created Using FXCM Marketscope 2.0
--- Written by Ilya Spivak, Currency Strategist for DailyFX.com
original source


