To receive Ilya's analysis directly via email, please SIGN UP HERE
Talking Points:
- AUD/USD Technical Strategy: Flat
- Waiting for Actionable Trade Setup to Emerge as Prices Oscillate in Familiar Range
- Dominant Multi-Year Trend, Triangle Pattern Argue in Favor of Broadly Bearish Bias
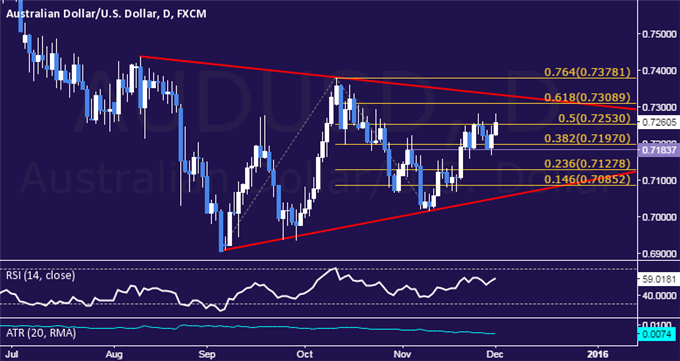
The Australian Dollar continues to oscillate in a now-familiar range below the 0.73 figure against its US counterpart after the RBA policy announcement failed to inspire volatility. Taking the longer view, prices appear to be carving out a symmetrical Triangle chart pattern, a setup favoring on-coming resumption of the dominant downward trend.
A daily close above the 50% Fibonacci expansion at 0.7253 opens the door for a challenge of the 0.7309-34 area, marked by the 61.8% level and the Triangle pattern top. Alternatively, a push below the 0.7184-97 zone – bracketed by a horizontal pivot and the 38.2%Fib – clears the way for a test of the 23.6% expansion at 0.7128.
The overall AUD/USD trend has broadly favored the downside since April 2013. The long-term boundaries of that move remain intact, suggesting that opportunities to sell ought to be favored versus the alternative. An actionable trade setup is absent for the time being however. As such, we will remain on the sidelines and wait for a compelling opportunity to present itself.
Losing Money Trading Forex? This Might Be Why.
original source


