To receive Ilya's analysis directly via email, please SIGN UP HERE
Talking Points:
- GBP/JPY Technical Strategy: Flat
- Support: 171.58, 170.54, 169.79
- Resistance: 172.30, 172.88-173.13, 173.47
The British Pound moved lower against the Japanese Yen as expected after producing a bearish Evening Star candlestick pattern. The emergence of positive RSI divergence preceded a correction higher as we suspected, with prices now testing the 38.2% Fibonacci retracementat 172.30. A daily close above this barrier exposes the 172.88-173.13 area, marked by a falling trend line and the 50% level. Alternatively, a reversal below the 23.6% Fib at 171.58 clears the way for a challenge of the August 15 low at 170.41.
Prices are too close resistance to justify entering long from a risk/reward perspective. On the other hand, the absence of a defined bearish reversal signal suggests taking up the short side is premature. With that in mind we will remain flat for now.
Add these technical levels directly to your charts with our Support/Resistance Wizard app!
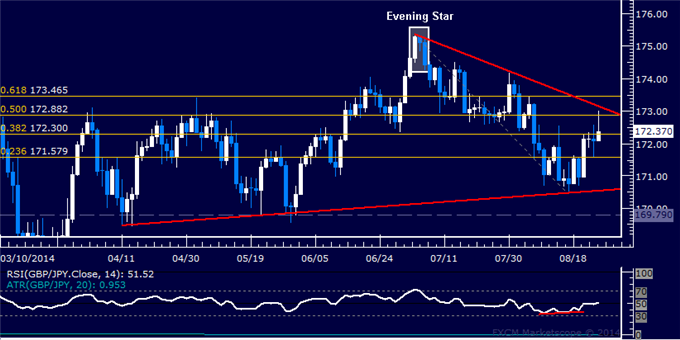
Daily Chart - Created Using FXCM Marketscope 2.0
--- Written by Ilya Spivak, Currency Strategist for DailyFX.com
original source


