Talking Points
- GBP/USD Technical Strategy: Shorts Preferred
- Bulls retreat following Doji formation on the daily
- Four hour chart provides mixed technical signals
GBP/USD is giving back some ground after staging an exceptional run to its 2014 high near 1.6820 last week. This has prompted a Doji candlestick to form which is signaling some indecision amongst traders. The posting of pursuant down-day provides further conviction to a bearish bias, and suggests a potential dip to prior resistance-turned support at 1.6660/2
GBP/USD: Doji Suggests Bulls In Doubt
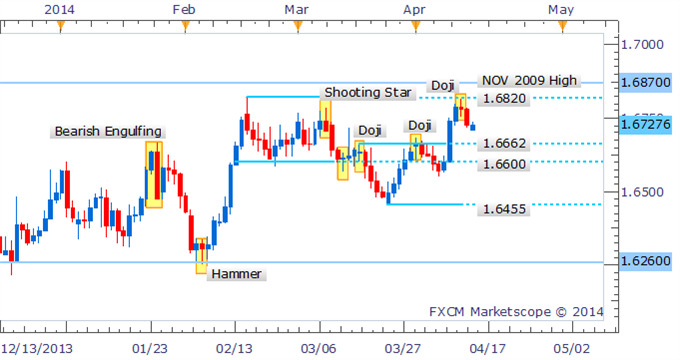
Daily Chart - Created Using FXCM Marketscope 2.0
Examining intraday price action using the four hour chart; a Dark Cloud Cover formation near resistance at 1.6815 suggests a bearish bias, however the recent emergence of a Piercing Line pattern offers a conflicting signal. Given that former support-turned-resistance is looming nearby at 1.6750, intraday gains may prove limited.
GBP/USD: Facing Mixed Signals In Intraday Trade
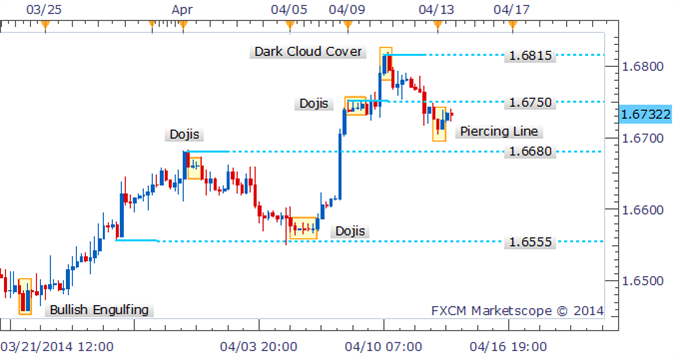
4 Hour Chart - Created Using FXCM Marketscope 2.0
This week’s gains for the pound have acted to negate the Dark Cloud Cover formation that had appeared near multi-year resistance for GBP/USD. The rally has arisen following a Piercing Line pattern which signaled the bulls were returning to the Cable. 1.6770 remains a critical level of resistance for the GBP/USD, given it has failed to close above the mark since 2008.
GBP/USD: Bulls Return As Piercing Line Forms on Weekly
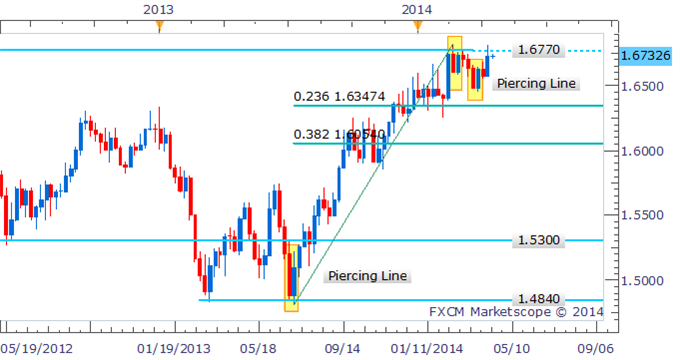
Weekly Chart - Created Using FXCM Marketscope 2.0
By David de Ferranti, Market Analyst, FXCM
Follow David on Twitter: @Davidde
To receive David’s analysis directly via email, please sign up here.
Learn how to read candlesticks to help identify trading opportunities with the DailyFX Candlesticks Video Course.
original source


