Talking Points
- GBP/USD Technical Strategy: pending short
- Dark Cloud Cover formation in intraday trade offers warning
- Doji on the daily suggests bulls in Doubt
GBP/USD is giving back some ground after staging an exceptional run to its 2014 high near 1.6820 in recent trading. This has prompted a Doji candlestick to form which is signaling some indecision amongst traders. A successive down-day would suggest a potential correction to prior resistance-turned support at 1.6660/2
GBP/USD: Doji Suggests Bulls In Doubt
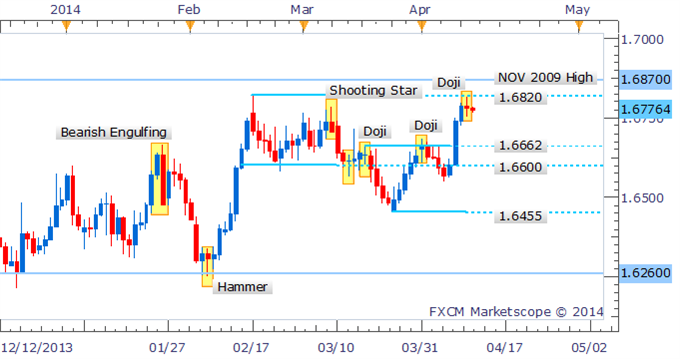
Daily Chart - Created Using FXCM Marketscope 2.0
Examining intraday price action using the four hour chart below; there are signs the bears are re-emerging. A Dark Cloud Cover formation near resistance at 1.6815 is indicating the potential for further declines. A break below support at 1.6750 would likely open a fall to 1.6680.
GBP/USD: Dark Cloud Cover Offers Warning
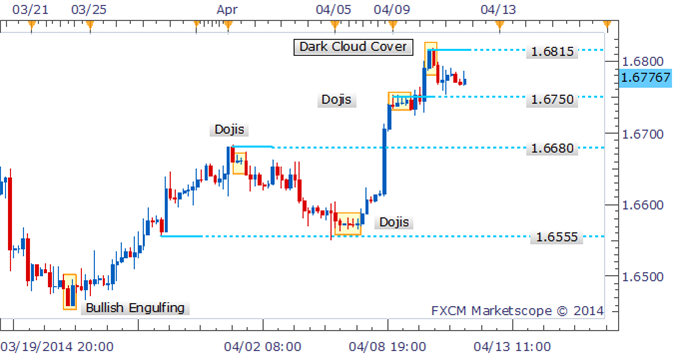
4 Hour Chart - Created Using FXCM Marketscope 2.0
This week’s gains for the pound have acted to negate the Dark Cloud Cover formation that had appeared near multi-year resistance for GBP/USD. The rally has arisen following a Piercing Line pattern which signaled the bulls were returning to the Cable.
GBP/USD: Bulls Return As Piercing Line Forms on Weekly
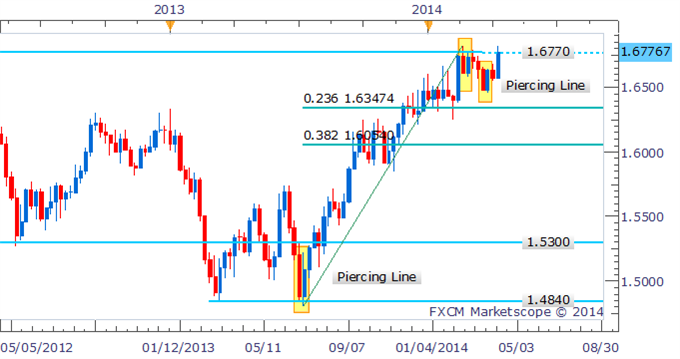
Weekly Chart - Created Using FXCM Marketscope 2.0
By David de Ferranti, Market Analyst, FXCM
Follow David on Twitter: @Davidde
To receive David’s analysis directly via email, please sign up here.
original source


