- EURUSD 1.1533-1.1680 zone may provide resistance
- GBPUSD could stall near 1.5878
- AUDUSD 6 week rally; first since Jan 2012
--Subscribe to Jamie Saettele's distribution list in order to receive a free report to your inbox several times a week.
--For more analysis and trade setups, visit SB Trade Desk
EUR/USD
Weekly
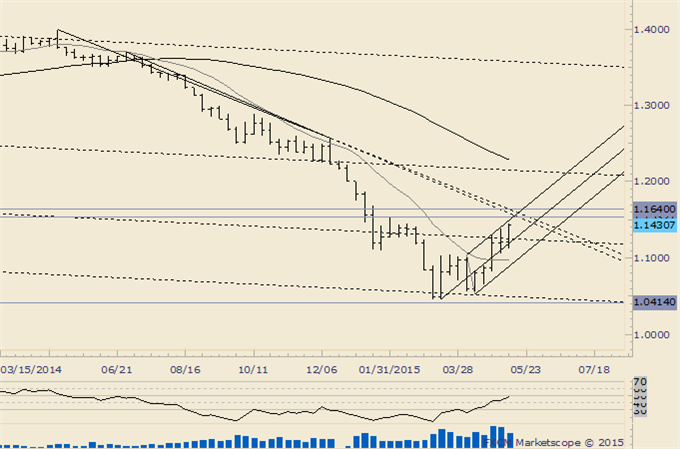
Chart Prepared by Jamie Saettele, CMT using Marketscope 2.0
Automate trades with Mirror Trader
-“Several longer term technical observations are worthy of note; the rate found low at an important long term level (line off of 2008 and 2010 lows) and the ownership profile (as per COT) is at a record. The speculative crowd has never been more bearish…ever. Such conditions typically precede important reversals…although not necessarily right away. A break above the resistance lines (old support) would indicate that behavior has significantly changed and open up a run on 1.13.”
-EURUSD has broken through the final resistance line from the slope that defines the decline from the 2014 high. While the near term move may be mature, a stretch into the Feb high at 1.1533 or even 2005 low at 1.1640 may be in order before sellers reemerge. The 1/21 high at 1.1680 is worth knowing as well. Eventually, 1.1050-1.11 (Jan low and res in April) could be of interest for support.
GBP/USD
Weekly
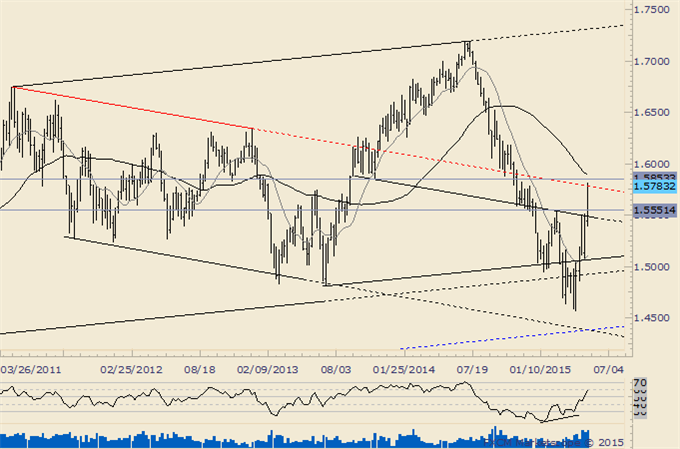
Chart Prepared by Jamie Saettele, CMT using Marketscope 2.0
Automate trades with Mirror Trader
-“The sharp turn higher (and pending weekly reversal) is promising for longer term bottoming prospects, especially in light of the mentioned divergence and 2 large range weekly reversals in the last 5 weeks. Focus is now on the sliding parallel (lower red line) just shy of 1.55 over the next several weeks.”
-“GBPUSD has met and slightly exceeded 1.55. This is resistance so the next near term move could go a long way in determining the next larger move. A break higher would open up the Dec high (near the next slope level) at 1.5785.” GBPUSD has attained 1.5785. Like EURUSD, the move up is mature. The 50% decline from the 2014 high / Oct low at 1.5874/78 could influence for a reaction lower. 1.5550 (Feb high and year open) would be of interest for support.
AUD/USD
Weekly
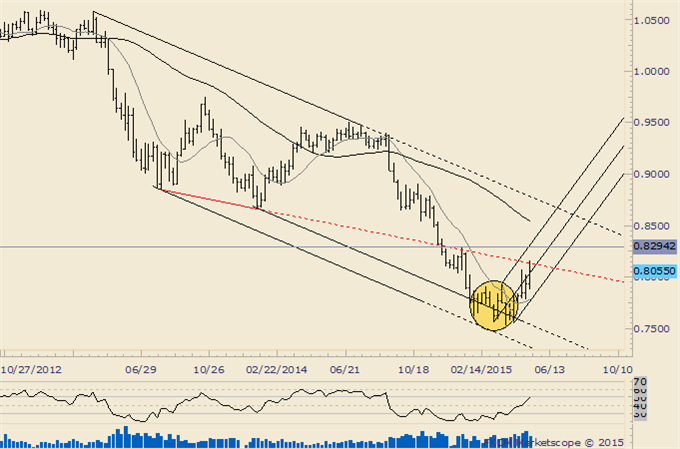
Chart Prepared by Jamie Saettele, CMT using Marketscope 2.0
Automate trades with Mirror Trader
-“Trade outside of the bearish upper parallel that has contained strength since late October would shift focus to a former support line (turned resistance in January) near .8180.”
-A broadening bottom pattern yields an objective of .8342 (just above the Jan high at .8294) but AUDUSD has met the line that extends off of the Aug 2013 and Jan 2014 lows (former support). .7920/40 may provide support.
NZD/USD
Weekly
Chart Prepared by Jamie Saettele, CMT using Marketscope 2.0
Automate trades with Mirror Trader
-“One can’t help but notice that an epic double top is possible with a target of .5898. That would trigger on a drop below .7370.”
-“The big NZDUSD double top has failed so far but slope resistance comes into play more or less at the current level and near .7800.” A bearish wedge pattern has formed and yields an objective of .6607.
USD/JPY
Weekly
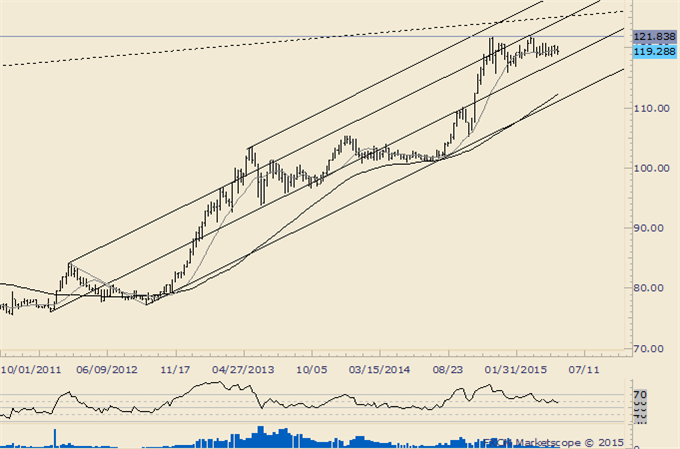
Chart Prepared by Jamie Saettele, CMT using Marketscope 2.0
Automate trades with Mirror Trader
-“Continue to favor a broad range as 119.80-120.70 as resistance and 116.40-117.10 as support. A move through either one of these zones would define target zones of 124-128 and 110-114.” I’ll add that the median line comes in near 118 and is an important reference point with respect to macro trend strength.
USD/CAD
Weekly
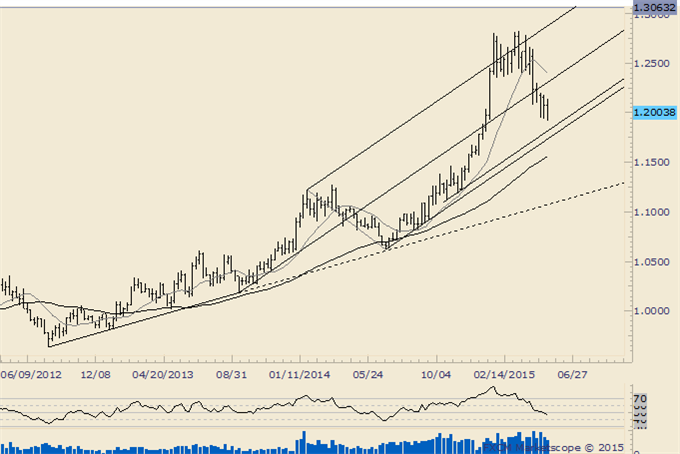
Chart Prepared by Jamie Saettele, CMT using Marketscope 2.0
Automate trades with Mirror Trader
-“The breakdown from a 2 and a half month topping pattern could ‘kick-off’ a much larger decline but near term focus is on early congestion from 1.1931 to 1.2046.”
-The latter level has been reached. The rate needs to establish above 1.2130 (bearish median line) in order to suggest that some sort of a low is in place. Until that happens, risk is lower towards about 1.1740 (slope lines).
USD/CHF
Weekly
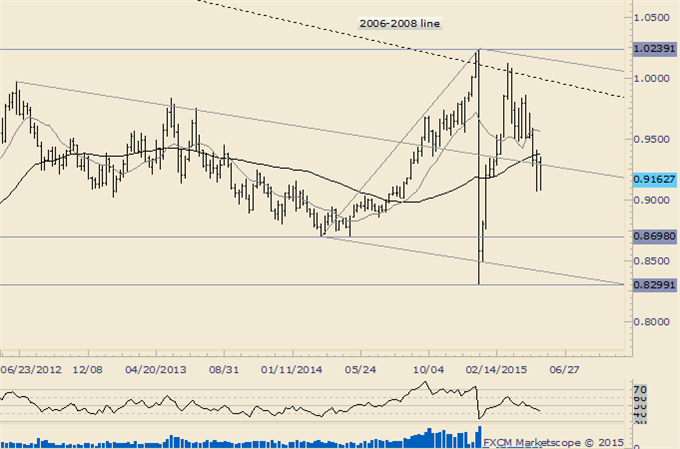
Chart Prepared by Jamie Saettele, CMT using Marketscope 2.0
Automate trades with Mirror Trader
-“USDCHF has reversed from 9 year trendline resistance. Focus is on the median line (about .9300) that extends off of the 2012 high. This line crosses through highs in 2013 and the October 2014 low. The 52 week MA is near this line as well.”
-USDCHF has broken beneath the median line. As such, look towards the 2014 low near .8700. Above .9360 would negate bearish implications and shift focus to April support near .9500.
original source


