To receive Ilya's analysis directly via email, please SIGN UP HERE
Talking Points:
- GBP/USD Technical Strategy: Flat
- Support: 1.5991, 1.5873. 1.5680
- Resistance: 1.6184, 1.6377, 1.6532
The British Pound is stumbling after bouncing as expected following the formation of a bullish Piercing Line candlestick pattern. Near-term resistance is now at 1.6184, the 23.6% Fibonacci retracement, with a break above that on a daily closing basis exposing the 38.2% level at 1.6377. Alternatively, a reversal below the 14.6% Fib expansion at 1.5991opens the door for a test of the 1.5873-93 area marked by the October 2013 low and the 23.6% threshold.
Prices are too close to support to justify entering short from a risk/reward perspective. On the other hand, the absence of a defined signal pointing to bullish resumption suggests that taking up the long side is premature. With that in mind we will remain flat for now.
Add these technical levels directly to your charts with our Support/Resistance Wizard app!
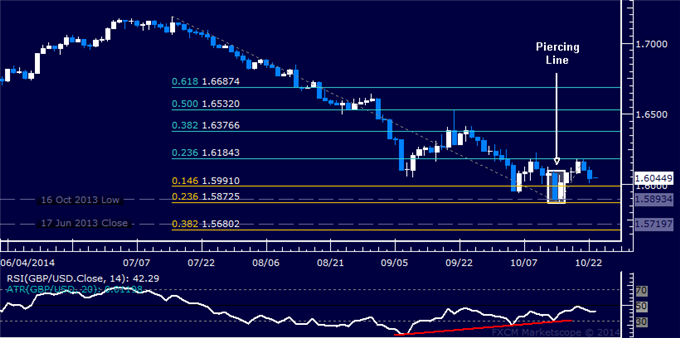
Daily Chart - Created Using FXCM Marketscope 2.0
--- Written by Ilya Spivak, Currency Strategist for DailyFX.com
original source

