To receive Ilya's analysis directly via email, please SIGN UP HERE
Talking Points:
- GBP/USD Technical Strategy: Flat
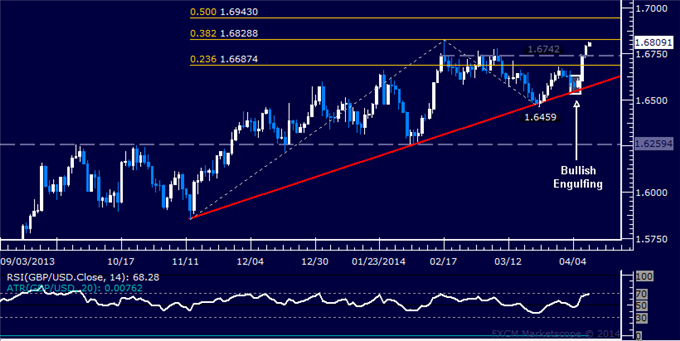
- Support:1.6742 (Feb 14 close), 1.6687 (23.6% Fib exp.)
- Resistance: 1.6829 (38.2% Fib exp.), 1.6943 (50% Fib exp.)
The British Pound advanced against the US Dollar as expected after prices formed a Bullish Engulfing candlestick pattern above trend line support set from mid-November. The pair is now testing resistance marked by the 38.2% Fibonacci expansion at 1.6829, with a break higher aiming for the 50% level at 1.6943. Alternatively, a turn below resistance-turned-support at 1.6742 – the February 14 close – exposes the 23.6% Fib at 1.6687.
Prices are too close to relevant resistance to justify a long position from a risk/reward perspective. On the other hand, the absence of a defined bearish reversal signal argues against taking up the short side. We will remain flat for now.
Confirm your chart-based trade setups with the Technical Analyzer. New to FX? Start Here!
Daily Chart - Created Using FXCM Marketscope 2.0
--- Written by Ilya Spivak, Currency Strategist for DailyFX.com
original source

