To receive Ilya's analysis directly via email, please SIGN UP HERE
Talking Points:
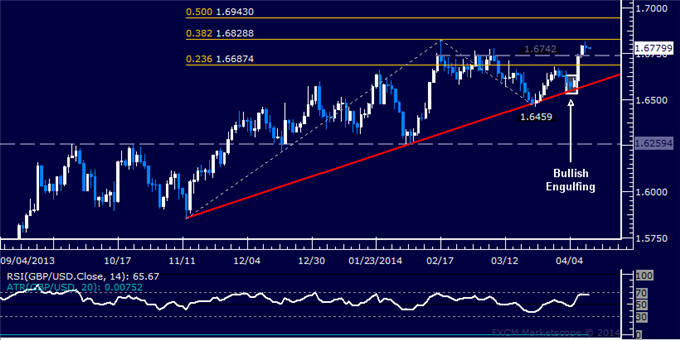
- GBP/USD Technical Strategy: Flat
- Support:1.6742 (Feb 14 close), 1.6687 (23.6% Fib exp.)
- Resistance: 1.6829 (38.2% Fib exp.), 1.6943 (50% Fib exp.)
The British Pound paused after three days of consecutive gains having followed the formation of a Bullish Engulfing candlestick pattern with a strong recovery, as expected. Prices are now testing resistance at 1.6829, the 38.2% Fibonacci expansion, with a daily close above this barrier initially exposing the 50% level at 1.6943. Alternatively, a turn below resistance-turned-support at 1.6742 – the February 14 close – targets the 23.6% Fib at 1.6687.
Risk/reward considerations argue against entering long with prices trading in close proximity to relevant resistance. On the other hand, taking up the short side looks premature absent a defined bearish reversal signal. With that in mind, we will remain flat for now.
Confirm your chart-based trade setups with the Technical Analyzer. New to FX? Start Here!
Daily Chart - Created Using FXCM Marketscope 2.0
--- Written by Ilya Spivak, Currency Strategist for DailyFX.com
original source


