To receive Ilya's analysis directly via email, please SIGN UP HERE
Talking Points:
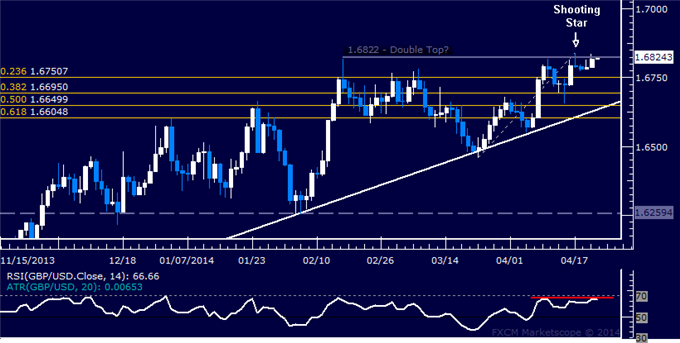
- GBP/USD Technical Strategy: Short at 1.6789
- Support:1.6751 (23.6% Fib ret.), 1.6695 (38.2% Fib ret.)
- Resistance: 1.6822 (Feb 17 high)
The British Pound may be carving out a double top below resistance at 1.6822against US Dollar, the February 17 high. Negative RSI divergence reinforces the probability of a downside scenario. Initial support line up at 1.6751, the 23.6% Fibonacci retracement, with a breach below this boundary on a daily closing basis exposing the 38.2% level at 1.6695.
We entered short GBP/USD at 1.6789, establishing a stop-loss to be activated on a daily close above 1.6822. Profit on half of the position will be booked and the stop-loss trailed to breakeven once the pair hits 1.6751. After that, the remainder of the trade will be left to develop any subsequent downside momentum.
Confirm your chart-based trade setups with the Technical Analyzer. New to FX? Start Here!
Daily Chart - Created Using FXCM Marketscope 2.0
--- Written by Ilya Spivak, Currency Strategist for DailyFX.com
original source


