To receive Ilya's analysis directly via email, please SIGN UP HERE
Talking Points:
- GBP/USD Technical Strategy: Flat
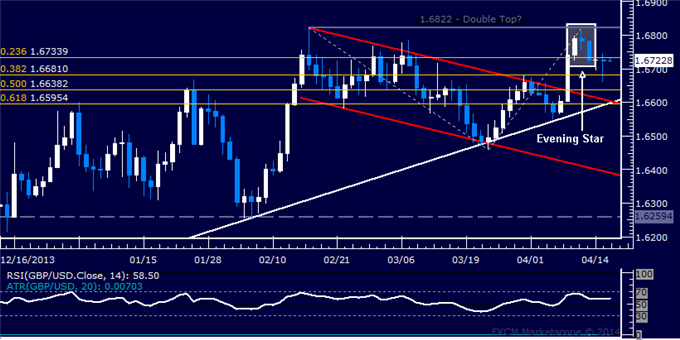
- Support:1.6681 (38.2% Fib exp.), 1.6638 (50% Fib exp.)
- Resistance: 1.6734 (23.6% Fib exp.), 1.6822 (Feb 17 high)
The British Pound may be carving out a Double Top chart formation against the US Dollar after prices completed a bearish Evening Star candlestick pattern below resistance at 1.6822, the February 17 high. An initial break below support at 1.6734, the 23.6% Fibonacci expansion, has exposed the 38.2% level at 1.6681. Pushing further beneath that eyes the 50% Fib at 1.6638. Alternatively a turn back above 1.6734 aims for 1.6822 anew.
A 53-pip trading range between near-term support and resistance doesn’t offer sufficient space for a short position given a 20-day ATR reading of 70 pips. We will continue to stand aside for now, looking for a more attractive setup to present itself.
Confirm your chart-based trade setups with the Technical Analyzer. New to FX? Start Here!
Daily Chart - Created Using FXCM Marketscope 2.0
--- Written by Ilya Spivak, Currency Strategist for DailyFX.com
original source


