To receive Ilya's analysis directly via email, please SIGN UP HERE
Talking Points:
- GBP/USD Technical Strategy: Flat
- Support: 1.5686, 1.5540, 1.5437
- Resistance: 1.5781, 1.5930, 1.6171
The British Pound advanced against the US Dollar as expected after prices put in a bullish Piercing Line candlestick pattern. A daily close above the 14.6% Fibonacci retracement at 1.5781 exposes the 23.6% level at 1.5930. Alternatively, a reversal below resistance-turned-support at a falling trend line set from mid-July – now at 1.5686 – clears the way for a test of the December 8 low at 1.5540.
The available trading range is too narrow to justify a trade on the long or short side from a risk/reward perspective. With that in mind, we will remain on the sidelines for now and wait for a more actionable opportunity to present itself.
Add these technical levels directly to your charts with our Support/Resistance Wizard app!
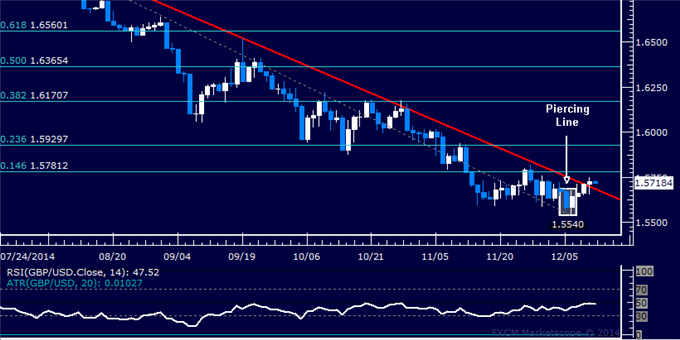
Daily Chart - Created Using FXCM Marketscope
--- Written by Ilya Spivak, Currency Strategist for DailyFX.com
original source

