To receive Ilya's analysis directly via email, please SIGN UP HERE
Talking Points:
- GBP/USD Technical Strategy: Flat
- Support: 1.5991, 1.5873. 1.5680
- Resistance: 1.6184, 1.6377, 1.6532
The British Pound advanced as expected against the US Dollar after prices put in a bullish Piercing Line candlestick pattern. Near-term resistance is now at 1.6184, the 23.6% Fibonacci retracement, with a break above that on a daily closing basis exposing the 38.2% level at 1.6377. Alternatively, a reversal below the 14.6% Fib expansion at 1.5991opens the door for a test of the 1.5873-93 area marked by the October 2013 low and the 23.6% threshold.
A bullish Head and Shoulders bottom chart formation may be in the works but confirmation is needed on a daily close above 1.6184 to make for an actionable setup. As such, we will continue to stand aside for the time being.
Add these technical levels directly to your charts with our Support/Resistance Wizard app!
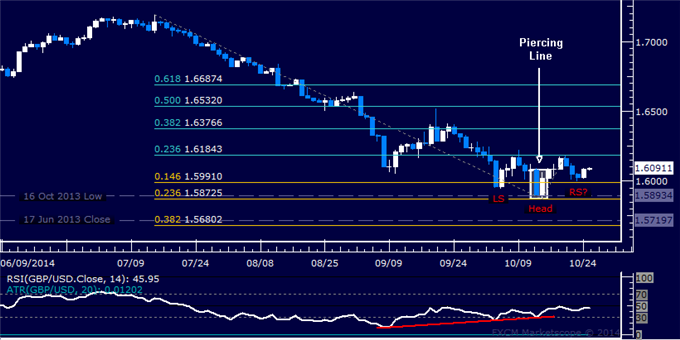
Daily Chart - Created Using FXCM Marketscope 2.0
--- Written by Ilya Spivak, Currency Strategist for DailyFX.com
original source


