To receive Ilya's analysis directly via email, please SIGN UP HERE
Talking Points:
- GBP/USD Technical Strategy: Flat
- Support: 1.5034, 1.4802, 1.4570
- Resistance: 1.5251, 1.5385, 1.5603
The British Pound is may have set a bottom against the US Dollar marked by the appearance of a bullish Morning Star candlestick pattern. Near-term resistance is at 1.5251, the 14.6% Fibonacci retracement, with a break above that on a daily closing basis exposing the 23.6% level at 1.5385. Alternatively, a reversal below the 76.4% Fib expansion at 1.5034 clears the way for a test of the 100% threshold at 1.4802.
Positioning is inconclusive at this point, with prices offering no clear-cut and actionable signal to initiate a long or short trade. We will continue to remain on the sidelines for the time being, waiting for a compelling opportunity to present itself.
Add these technical levels directly to your charts with our Support/Resistance Wizard app!
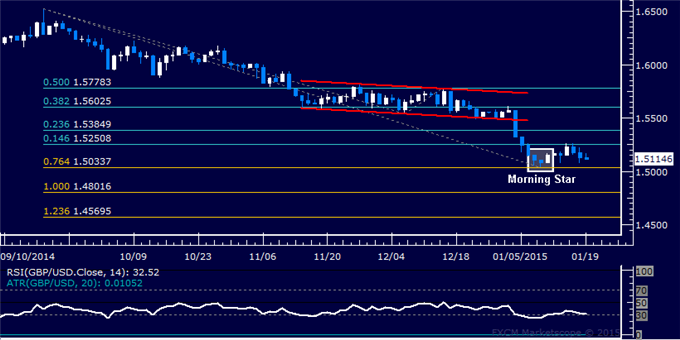
Daily Chart - Created Using FXCM Marketscope
--- Written by Ilya Spivak, Currency Strategist for DailyFX.com
original source


