To receive Ilya's analysis directly via email, please SIGN UP HERE
Talking Points:
- GBP/USD Technical Strategy: Flat
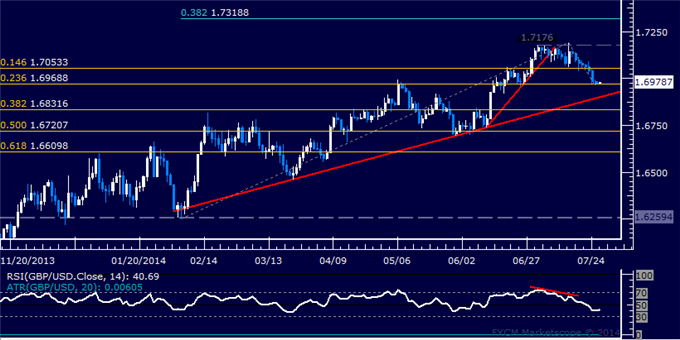
- Support: 1.6969, 1.6901, 1.6832
- Resistance:1.7053, 1.7176, 1.7319
The British Pound is digesting losses against the US Dollar having turned lower as expected after showing a Hanging Man candlestick with negative RSI divergence. A daily close below 1.6969, the 23.6% Fibonacci retracement, exposes a rising trend line set from early February, now at 1.6901. Alternatively, a bounce above resistance at 1.7053, the 14.6% Fib, clears the way for a challenge of the July 2 top at 1.7176.
Prices are too close to support to justify entering short from a risk/reward perspective. On the other hand, the absence of a defined bullish reversal signal argues against taking up the long side. We will remain flat for now.
Add these technical levels directly to your charts with our Support/Resistance Wizard app!
Daily Chart - Created Using FXCM Marketscope 2.0
--- Written by Ilya Spivak, Currency Strategist for DailyFX.com
original source


