To receive Ilya's analysis directly via email, please SIGN UP HERE
Talking Points:
- GBP/USD Technical Strategy: Flat
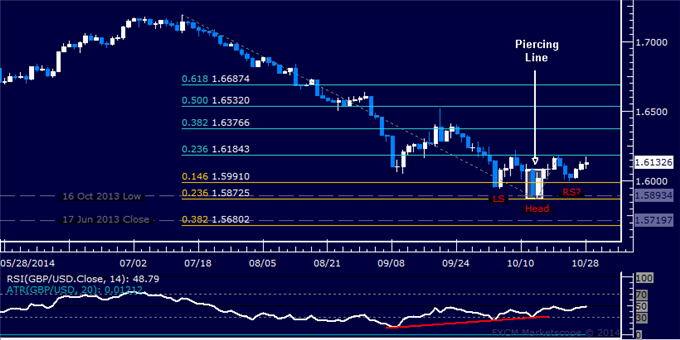
- Support: 1.5991, 1.5873. 1.5680
- Resistance: 1.6184, 1.6377, 1.6532
The British Pound advanced as expected against the US Dollar after prices put in a bullish Piercing Line candlestick pattern. Near-term resistance is now at 1.6184, the 23.6% Fibonacci retracement, with a break above that on a daily closing basis exposing the 38.2% level at 1.6377. Alternatively, a reversal below the 14.6% Fib expansion at 1.5991opens the door for a test of the 1.5873-93 area marked by the October 2013 low and the 23.6% threshold.
A bullish Head and Shoulders bottom chart formation may be in the works but confirmation is needed on a daily close above 1.6184 (the would-be pattern’s neckline) to make for an actionable setup. As such, we will continue to stand aside for the time being.
Add these technical levels directly to your charts with our Support/Resistance Wizard app!
Daily Chart - Created Using FXCM Marketscope 2.0
--- Written by Ilya Spivak, Currency Strategist for DailyFX.com
original source


