To receive Ilya's analysis directly via email, please SIGN UP HERE
Talking Points:
- GBP/USD Technical Strategy: Flat
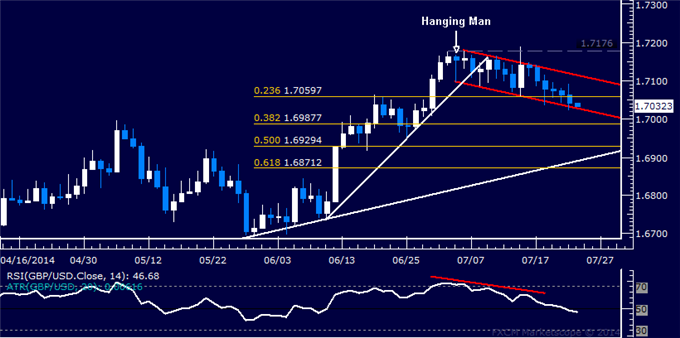
- Support: 1.7026, 1.6988, 1.6929
- Resistance:1.7060, 1.7113, 1.7176
The British Pound continues to drift downward against US Dollar as expected after the pair showed a Hanging Man candlestick reinforced by negative RSI divergence. Near-term support is at 1.7026, marked by the bottom of a falling channel in play since the beginning of this month. A daily close below that targets the 38.2% Fibonacci retracement at 1.6988. Alternatively, a reversal back above the 23.6% level at 1.7060 opens the door for a move to the channel top at 1.7113, followed by the July 2 high at 1.7176.
Prices are wedged too closely between near-term support and resistance levels to justify entering a trade on the long or short side from a risk/reward perspective. We will continue to stand aside for now, waiting for an actionable opportunity to present itself.
Add these technical levels directly to your charts with our Support/Resistance Wizard app!
Daily Chart - Created Using FXCM Marketscope 2.0
--- Written by Ilya Spivak, Currency Strategist for DailyFX.com
original source


