To receive Ilya's analysis directly via email, please SIGN UP HERE
Talking Points:
- GBP/USD Technical Strategy: Pending Short
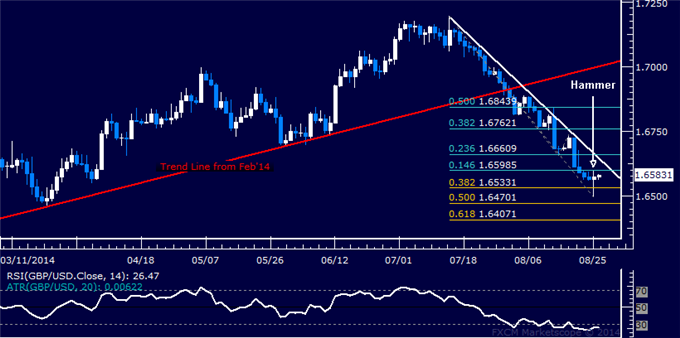
- Support: 1.6533, 1.6470, 1.6407
- Resistance:1.6599, 1.6648-61, 1.6762
The British Pound may be preparing to launch a corrective bounce against the US Dollar after prices put in a Hammer candlestick above the 1.6500 figure. Near-term resistance is at 1.6599, the 14.6% Fibonacci retracement, with a daily close above that exposing the 1.6648-61 area marked by a falling trend line set from mid-July and the 23.6% level. Alternatively, a turn below the 38.2% Fib expansion at 1.6533 clears the way for a challenge of the 50% threshold at 1.6470.
A Hammer candlestick represents indecision and does not amount to an actionable trade signal by itself. Furthermore, the break of trend line support set from February 2014 argues for a broadly bearish bias. With that in mind, we will wait for any on-coming bounce from current levels and treat it as a selling opportunity.
Add these technical levels directly to your charts with our Support/Resistance Wizard app!
Daily Chart - Created Using FXCM Marketscope 2.0
--- Written by Ilya Spivak, Currency Strategist for DailyFX.com
original source

