To receive Ilya's analysis directly via email, please SIGN UP HERE
Talking Points:
- GBP/USD Technical Strategy: Flat
- Support: 1.5664, 1.5551, 1.5444
- Resistance: 1.5801, 1.6021, 1.6241
The British Pound declined against the US Dollar as expected after prices produced a Bearish Engulfing candlestick pattern. A daily close below the 14.6% Fibonacci retracement at 1.5631 exposes the 1.5519-51 area (23.6% level, February 26 high). Alternatively, a reversal above the 76.4% Fib at 1.5801 clears the way for a test of the 100% expansion at 1.6021.
Prices are too close to support to justify entering short from a risk/reward perspective. On the other hand, the absence of a defined bullish reversal signal suggests that taking up the long side is premature. With that in mind, we will remain flat for now.
Add these technical levels directly to your charts with our Support/Resistance Wizard app!
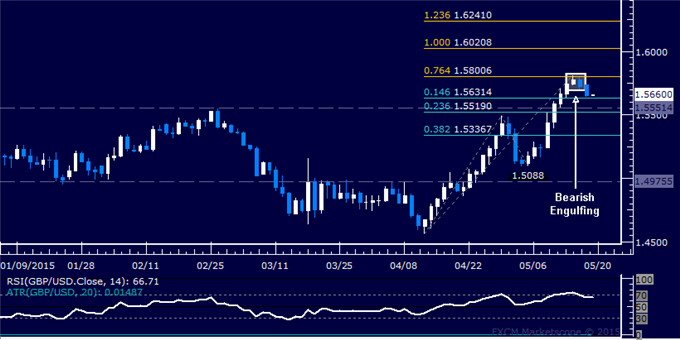
Daily Chart - Created Using FXCM Marketscope
--- Written by Ilya Spivak, Currency Strategist for DailyFX.com
original source

