Talking Points:
- Retail GBP/USD Sentiment Approaches Post-Brexit Extreme as Weakness Persists.
- USDOLLAR Struggles as Mixed U.S. Data Dampens Bets for 2016 Fed Rate-Hike.
Avoid the pitfalls of trading by steering clear of classic mistakes. Review these principles in the "Traits of Successful Traders" series.
GBP/USD
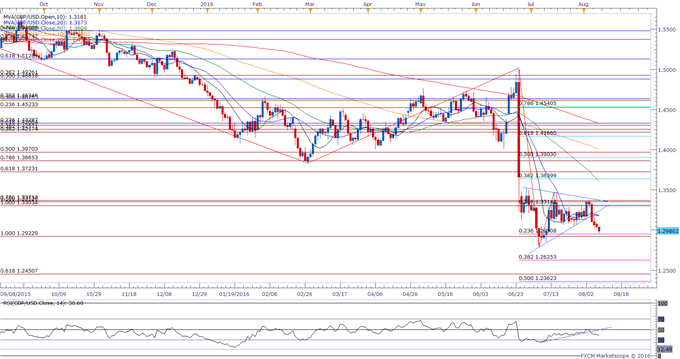
Chart - Created Using FXCM Marketscope 2.0
- GBP/USD stands at risk for further losses as it breaks down from the triangle/wedge formation carried over from the previous month, with the Relative Strength Index (RSI) largely following suit; may see the exchange rate grind to fresh 2016 lows as the long-term bearish trend appears to be reasserting itself.
- Fresh comments from the Bank of England’s (BoE) Ian McCafferty suggests the Monetary Policy Committee (MPC) will further reduce the benchmark interest rate over the coming months as central bank officials ‘believe that more easing is likely to be required,’ but the fresh easing cycle may have limited consequences for the sterling especially as Governor Mark Carney rules out a zero/negative-interest rate policy for the U.K.
- Break/close below the Fibonacci overlap around 1.2920 (100% expansion) to 1.2950 (23.6% retracement) may open up the July low (1.2788) followed by 1.2630 (38.2% expansion).
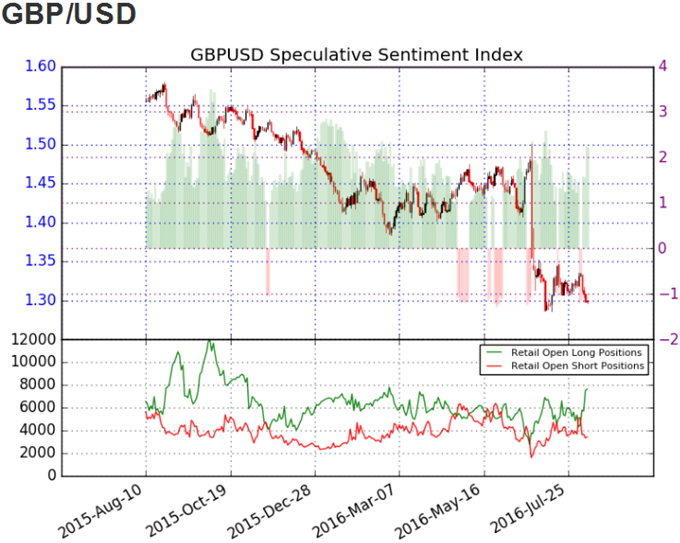
- The DailyFX Speculative Sentiment Index (SSI) shows the retail FX crowd remains net-long GBP/USD since August 4, with the ratio hitting an extreme following the U.K. Referendum as it spiked to 2.96 in the first full-week of July.
- The ratio appears to be working its way back towards recent extremes as it currently stands at +2.29, with 70% of traders long, while long positions are 58.5% higher from the previous week.
Why and how do we use the SSI in trading? View our video and download the free indicator here
USDOLLAR(Ticker: USDollar):
Index | Last | High | Low | Daily Change (%) | Daily Range (% of ATR) |
DJ-FXCM Dollar Index | 11970.18 | 12002.19 | 11962.33 | -0.10 | 72.81% |
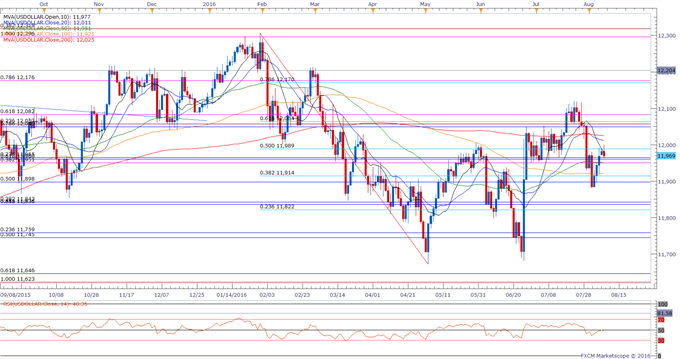
Chart - Created Using FXCM Marketscope 2.0
- The USDOLLAR pulls back from a fresh monthly high of 12,001, with the greenback at risk of a larger correction as the mixed data prints coming out of the U.S. economy raises the Fed’s scope to retain its current policy at the next quarterly policy meeting in September.
- Indeed, Fed Funds Futures have edged higher following the 255K expansion in U.S. Non-Farm Payrolls (NFP), but it seems as though market participants remain reluctant to position for a 2016 rate-hike as the December contract continue to highlight a 40% probability for higher borrowing-costs.
- Will retain a constructive outlook for the USDOLLAR as long as it holds above 11,951 (38.2% expansion) to 11,965 (23.6% retracement), but the failed attempts to close above 11,989 (50% retracement) raises the risk for a larger pullback.
Click Here for the DailyFX Calendar
Get our top trading opportunities of 2016 HERE
Check out FXCM’s Forex Trading Contest
Read More:
COT-Record British Pound Ownership Profile
GBP/JPY Technical Analysis: Tug-of-War at the ’Brexit-Low’
WTI Crude Oil Price Forecast: Bear Market Prompts OPEC Meeting
Weekly Technicals: NZD/USD - Bye Bye Birdie
--- Written by David Song, Currency Analyst
To contact David, e-mail dsong@dailyfx.com. Follow me on Twitter at @DavidJSong.
To be added to David's e-mail distribution list, please follow this link.
original source


