Talking Points:
- Markets are headed for a heavy week of data, with high-importance prints on the docket for each day this week, with a heavy allocation of US data including Non-Farm Payrolls on Friday.
- The US Dollar continues its bullish price action as it appears as though the Greenback is attempting to carve-out higher-low support near old, prior resistance.
- If you’re looking for trading ideas, check out our Trading Guides. And if you want something more short-term in nature, check out our SSI indicator. If you’re looking at opening a trading account, FXCM has a contest at the beginning of next month for certain account holders. Click here for full details.
As we close the books on May, one of the most aggressive themes of the month is in the spotlight as we near a bevy of data releases. The US Dollar has become a major focal point across markets as traders and investors have been factoring in expectations around US rate policy for the coming months. And as we entered the month of May, the odds of getting a hike in June dropped dramatically after an abysmal Non-Farm Payrolls report. But throughout the month we received near-constant hints from Fed members that a rate hike in June is not completely off the table; with the April FOMC Meeting minutes going so far as to say that the bank felt that markets were underpricing the probability of a hike in June.
That next FOMC meeting is two weeks away, but fully expect this topic to take center stage in markets as traders look for clues and hints in the outsized amount of data that will be delivered this week; with particular interest cast around US data on Tuesday (Consumer Confidence), Wednesday (ISM Manufacturing) and Friday (Non-Farm Payrolls for the month of May). Also potentially relevant to US Dollar trends is the European Central Bank meeting on Thursday morning. No action is expected at that meeting as the bank will likely still be evaluating data after the large increase to stimulus made very recently; but commentary on the global economy or signs of growth or initial signs of economic stability in Europe can all be seen as risk positive, which could bring on additional US Dollar strength.
As we enter this labyrinth of data prints, The US Dollar is finding support at a zone of old resistance. The Fibonacci retracement that we’ve been discussing using the prior major move of last April’s high to last May’s low has produced numerous usable levels for traders. The current level of interest on the Dow Jones FXCM Dollar Index is at 11,960, which is the 61.8% retracement of that prior major move. We first looked at this level two weeks ago as USD ran into this level as resistance. The next few days in the Greenback produced a rather consistent range as this level of resistance was able to stymie the buying demand that had throttled USD higher. And after a quick break of that short-term support, the US Dollar began to throttle higher, and this made risk trends in pairs like the Euro really stand out as major support levels gave way to a strong Greenback.
At this stage, we are supported at old resistance, and this is often looked at as a continuation type of setup; as in traders can look to buy ‘higher low’ support after this support is confirmed.
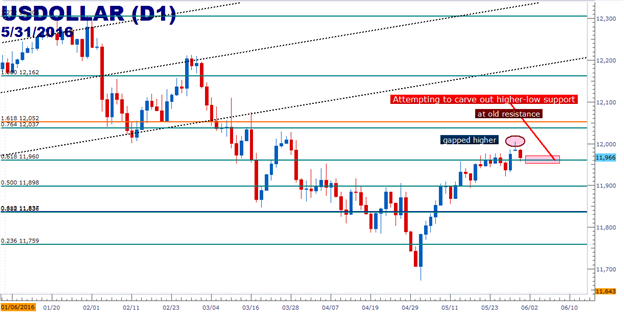
Created with Marketscope/Trading Station II; prepared by James Stanley
Where Traders May Look to Buy USD
With such a predominant trend showing throughout the month, many major currencies yielded to the strength of the Greenback as those US rate hike expectations for June continued to increase. So many major currency pairs put in reversals throughout the month, and a large portion of the ‘why’ was the rampant strength being seen in the Dollar. Below, we go over three different technical setups across markets that traders may be watching in order to strike on the continuation of US Dollar strength.
EUR/USD
This had presented one of the cleaner technical moves and we’ve been discussing this setup for the last couple of weeks. The big level on EUR/USD was 1.1212, which is the 61.8% retracement of the lifetime move in the currency pair, taking the low from October in the year 2000 at .8230 to the 2008 high of 1.6037. This level has also provided numerous support and resistance hits over the past 16 months, most recently providing the April swing low in the pair. Last week saw EUR/USD finally drop below this level of support, at which point the pair quickly found resistance off of this old support.
Traders can look to sell a lower ‘swing high’ in EUR/USD in the effort of catching the continuation move higher in USD.
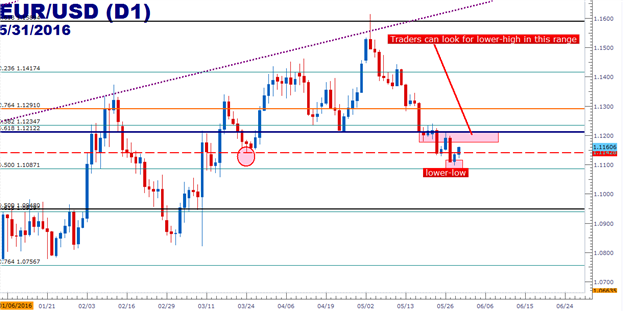
Created with Marketscope/Trading Station II; prepared by James Stanley
AUD/USD
The Australian Dollar put in a massive reversal in May after the Australian Central Bank cut rates on May 3rd. This had helped to carve that bottom in the US Dollar in the early portion of the month, and that day’s price action also produced a bullish engulfing candlestick in USD to begin the reversal.
The continuation of this move sent AUD/USD spiraling down to a confluent area of support in the .7183-.7203 vicinity. Each of these levels are long-term Fibonacci retracements, with .7183 being the 61.8% retracement of the lifetime move in the pair (taking the low from the year 2000 at .4775 to the 2011 high of 1.1079), while .7203 is the 76.4% retracement of the secondary move, taking the 2008 Financial Collapse low to the 2011 high in the pair. This confluent zone of support was too strong for a continuation move in the Aussie, as we’ve seen prices reversing after being unable to break lower throughout much of last week.
But 40 pips higher we have a trend-line projection (which can be found by drawing a trend-line across the two lows mentioned above, from the year 2000 low to the 2008 low, and then projecting to current price action); and just above that we have a prior swing low at .7307. This could be a very interesting level of resistance.
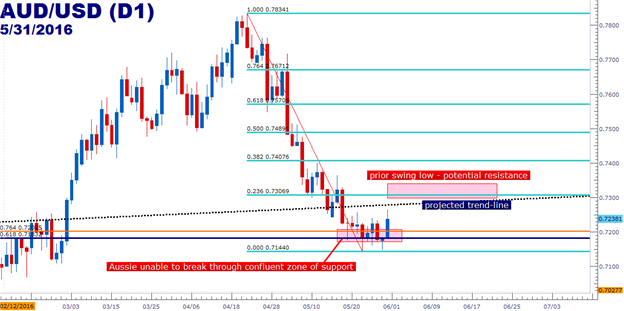
Created with Marketscope/Trading Station II; prepared by James Stanley
Gold
As it appeared increasingly unlikely that we’d be getting a rate hike out of the United States anytime soon as the Fed went dovish after the risk aversion at the beginning of the year, Gold prices caught a major bid, breaking out of a down-ward sloping channel that had run for over two years in the yellow metal. But as the Fed anchored those expectations higher through May, Gold put in a nasty reversal that wiped away much of those previous gains.
Yesterday morning saw yet another major support level come into play in Gold, and this is the 61.8% retracement of the 45-year move in Gold, taking the low from the late 60’s at $34.95 to the 2011 high at $1,920.80. That Fibonacci retracement comes in at a $1,200.41; and $1,200 is a psychological level in Gold, so yet another reason for support to show.
Traders would want to approach this one cautiously as such a major support level could have a tendency to bring additional buyers into the mix or, at the very least, give sellers enough reason to pause before looking at down-trend continuation patterns. There is a potential resistance level at $1,217.26, and this could be attractive should resistance actually form there in the effort of looking for a continuation move back down to support in the $1,200 vicinity.
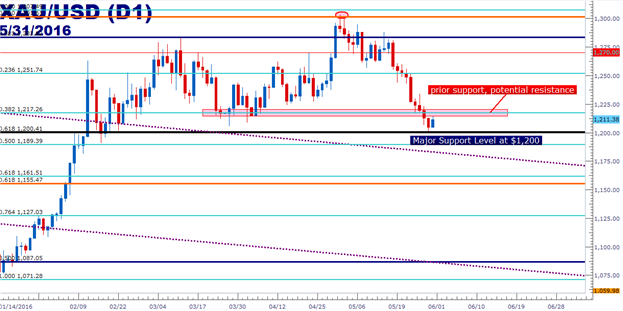
Created with Marketscope/Trading Station II; prepared by James Stanley
--- Written by James Stanley, Analyst for DailyFX.com
To receive James Stanley’s analysis directly via email, please SIGN UP HERE
Contact and follow James on Twitter: @JStanleyFX
original source


