Talking Points:
- EUR/USD forming a bearish technical pattern following the Yellen speech at Jackson Hole
- German CPI, Stanley Fischer interview and US Consumer Confidence are in focus ahead
- Euro-Zone CPI has been under the ECB target since January 2013
The EUR/USD is trading below the 1.12 handle at the time of writing, after the pair spiked lower and formed a bearish daily engulfing bar following the Yellen speech at Jackson Hole.
The Fed Chairwoman said that “the case for an increase in the federal funds rate has strengthened in recent months”, but the market’s hawkish tilt seemed to have come after the Stanley Fischer interview later that day.
This puts the spotlight on Fischer ahead, with German CPI and US Consumer Confidence figures also on tap.
Against this backdrop we will form our outlook and look to find short term trading opportunities using different tools such as the Grid Sight Index (GSI) indicator.
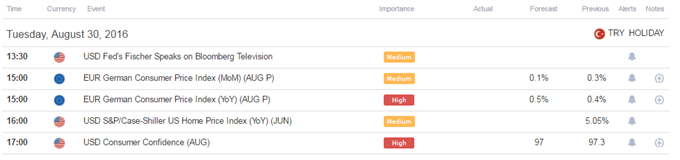
Click Here for the DailyFX Calendar
Fed’s Fischer is set to speak with Bloomberg TV around 10:30 GMT. The Fed’s vice chair comments seemed to have been the tipping point this past Friday for the market’s overall hawkish interpretation for Yellen’s speech, as Fischer claimed the Yellen speech is in line with two rate hikes this year.
This could be another opportunity for Fischer to really emphasize the possibility for a September hike, possibly sending the US Dollar higher.
German August Preliminary CPI is on tap as well. The YoY figure is expected to uptick for a 0.5% print from the prior 0.4% figure, while the month-on-month number is expected to slow.
The reading from the Euro-Zone’s largest economy could give an early indication for the inflationary situation before the region-wide figures tomorrow- potentially highlighting the major task in front of the ECB if they are to bring inflation close to 2%.
Indeed, the ECB has failed to hit target since January 2013.
European Central Bank Executive Board member Benoit Coeure said at the Jackson Hole Economic Policy Symposium that “if other actors do not take the necessary measures in their policy domains, we may need to dive deeper into our operational framework and strategy to do so.”
In turn, this could imply that if data continues to show a lack of meaningful pickup, the ECB might have to expand easing, potentially portraying a bearish outlook for the currency.
US Consumer Confidence is set to hit the wires as well, and is expected to slightly slow for a 97.0 print from the 97.3 prior figure.
A better than expected print could prove influential in the context of the Fed looking to hike as we head into the NFPs later this week.
EUR/USD Technical Levels:

Click here for the DailyFX Support & Resistance tool
We use volatility measures as a way to better fit our strategy to market conditions. The Euro is expected to be the least volatile major currency versus the US Dollar based on 1-week and 1-month implied volatility measures.
Indeed, 20-day ATR measure confirm quite subdued levels of volatility. With that said, further increase in Fed rate hike expectations and dovish ECB commentary (combined with higher participation after the summer vacations) could see thing pick up ahead.
In turn, this may suggest that key technical levels might be able to hold in the short term.
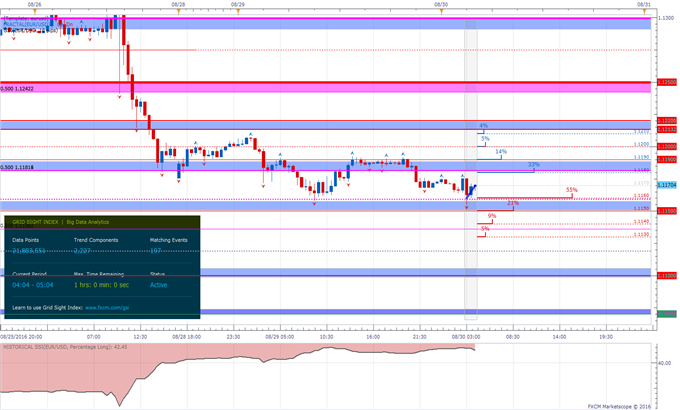
EUR/USD 30-Min Chart (With the GSI Indicator): August 30, 2016
(Click to Enlarge)
The EUR/USD is finding support at the moment at a potential support zone above 1.1150, with GSI calculating higher percentage of past movement to the downside in the short term.
The GSI indicator above calculates the distribution of past event outcomes given certain momentum patterns. By matching events in the past, GSI describes how often the price moved in a certain direction.
You can learn more about the GSI here, and download the Trade Station version here.
Further levels of support might be 1.1136, 1.1100, 1.1070 and 1.1050.
Levels of resistance may be the areas below 1.1190 and 1.1220 followed by a key zone below 1.1250 and the 1.13 level.
We generally want to see GSI with the historical patterns significantly shifted in one direction, which alongside a pre-determined bias and other technical tools could provide a solid trading idea that offer a proper way to define risk.
We studied over 43 million real trades and found that traders who successfully define risk were three times more likely to turn a profit.
Read more on the “Traits of Successful Traders” research.
Meanwhile, the DailyFX Speculative Sentiment Index (SSI) is showing that about 42.3% of FXCM’s traders are long the EUR/USD at the time of writing reducing shorts quickly on the drop, perhaps implying that retail traders are taking profits/ positions off too quickly (see the “Traits of Successful Traders” research ).
You can find more info about the DailyFX SSI indicator here
--- Written by Oded Shimoni, Junior Currency Analyst for DailyFX.com
To contact Oded Shimoni, e-mail oshimoni@dailyfx.com
Follow him on Twitter at @OdedShimoni
original source


