- EUR/USD regime shift coming?
- Long term AUD/USD bear trap
- Kiwi re-takes pre-Brexit high
--Subscribe to Jamie Saettele's distribution list in order to receive a free report to your inbox several times a week.
--For more analysis and trade setups (including current positions and the ‘watchlist’), visit SB Trade Desk
--Free trading tips
EUR/USD
Weekly
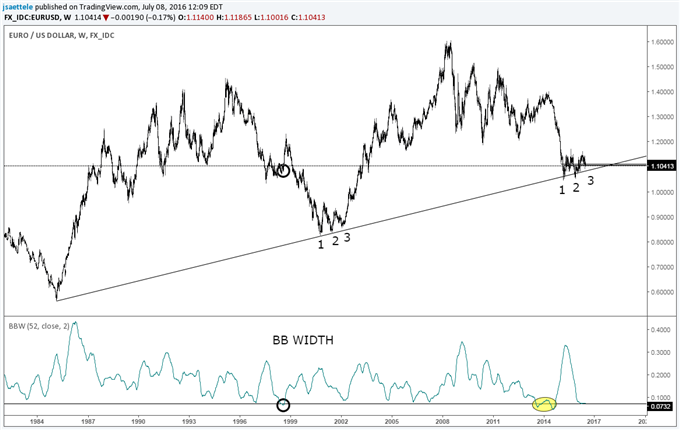
Chart Prepared by Jamie Saettele, CMT
See REAL TIME trader positioning
High Frequency Trading Tools
-FXTW wrote in early May that “EUR/USD broke through (resistance) on an intraweek basis but finished the week with a long upper wick that warns of a ‘bull trap’. It seems right to be (long term) bullish given the 31 year trendline support but the breakout may have to wait a bit. As always, define your risk points (read more about traits of successful traders here). FXTW was also of the mind however that the May low at 1.1097 would hold…then Brexit happened. A broad view reveals that nothing has really changed however. 52 week Bollinger Band ® width on EUR/USD is at the lower end of its historical range. Volatility is mean reverting so prepare for a change in market conditions from range to trend.
-For forecasts and 2016 opportunities, check out the DailyFX Trading Guides.
GBP/USD
Weekly
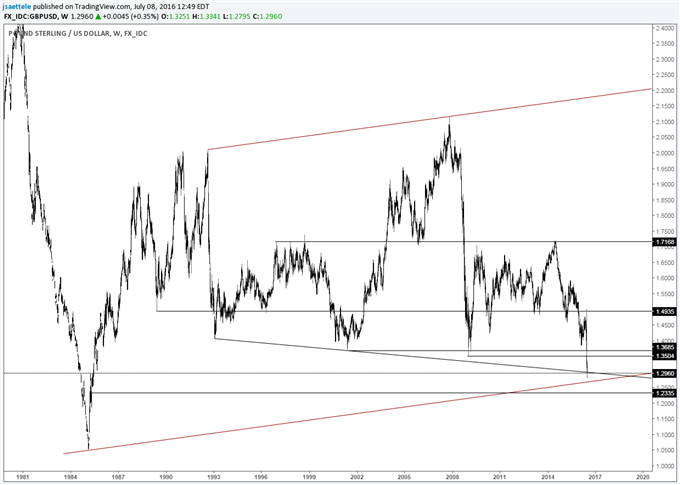
Chart Prepared by Jamie Saettele, CMT
See REAL TIME trader positioning
-The gap to open trading post-Brexit is thus far of the breakaway variety. The current level (slope lines) and/or 1.2500 could inspire a ‘squeeze’ as part of consolidation before another leg lower. 1.2500 relates the 2009-2014 range (127.2% of that range from the 2014 high) and decline from 2007 (decline from 2014 = .618% of 2007-2008 decline). Former supports at 1.3500-1.3700 should now be watched for resistance. Remember, there is a 96 month (8 year) cycle low count.
AUD/USD
Weekly
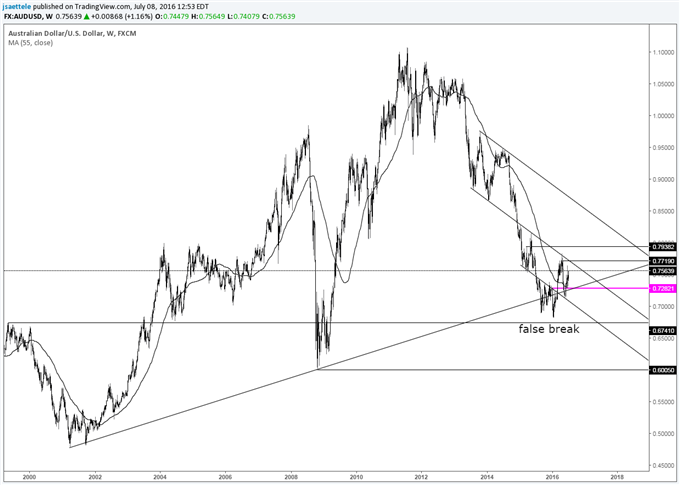
Chart Prepared by Jamie Saettele, CMT
See REAL TIME trader positioning
-There is no change to the weekly AUD/USD analysis. “AUD/USD is constructive because former support turned resistance was support again several weeks ago (from a parallel). What’s more, this week’s low registered a few ticks above the opening price for the year (we call this the ‘touch and go’ over at SB Trade Desk). The next decision point may be above .7700 (the next parallel).”
NZD/USD
Weekly
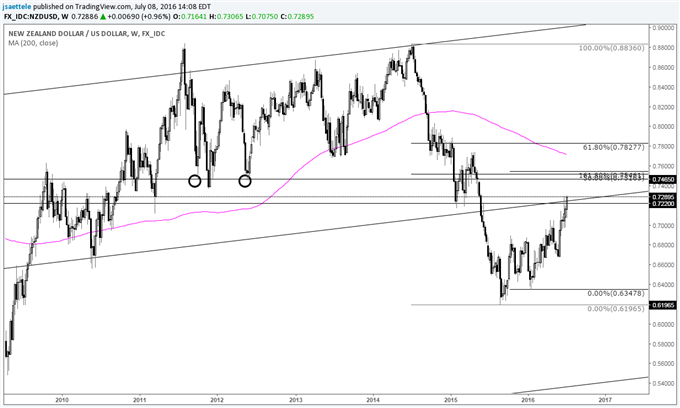
Chart Prepared by Jamie Saettele, CMT
See REAL TIME trader positioning
-The last NZD/USD weekly update noted that “a long term parallel and major horizontal levels (including the 1988 high) could cap the rally from August 2015 while a break above this level would be a significant development. Bottom line, the current juncture commands attention as a major decision point.” Kiwi has taken out the pre-Brexit high and a breakout targets the .7500 area. The 50% retracement of the decline from 2014 is .7520 while the 2005 high and 2012 low are near .7465.
USD/JPY
Monthly
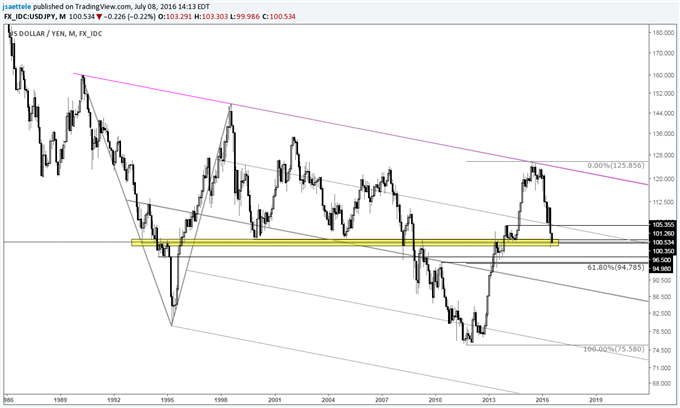
Chart Prepared by Jamie Saettele, CMT
See REAL TIME trader positioning
-USD/JPY is in freefall. FXTW thought that the low at 103.56 would prove more significant given the presence of the May 2013 high at 103.74 but also noted that “the next level of interest would not be until the 2000 and 2014 lows at 100.74-101.26.” Much to the chagrin of the technician (but not the trader…), a ‘shock’ event resulted in panic below 99! Price has stabilized in the vicinity of the noted 2000 and 2014 lows but whether or not the last week is a pause or a change in trend is unanswerable. Strength above 105.40 is needed in order to suggest that the upside is again viable. Until then, the area around 95 (next historical inflection point and 61.8% of rally from 2011) looms as a magnet.
USD/CAD
Weekly
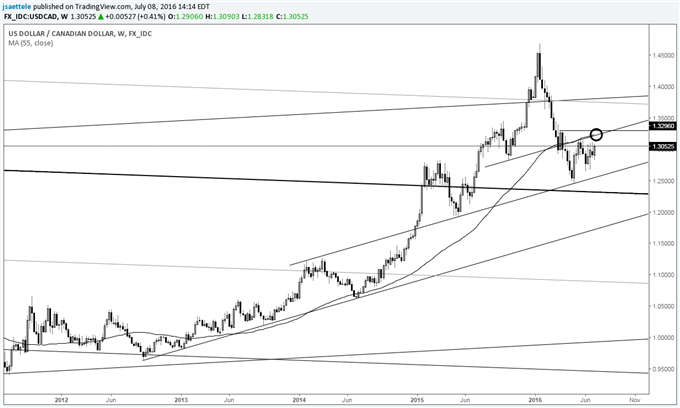
Chart Prepared by Jamie Saettele, CMT
See REAL TIME trader positioning
-Previous comments noted that “USD/CAD has carved a bullish engulfing candle at major support. The low just made could be significant.” The bullish engulfing is still there of course but the rally has failed at the 55 week average. FXTW pays attention to this because this average was support for the last 3 years. Former support just provided resistance so USD/CAD may be transitioning to a bearish phase.
USD/CHF
Weekly
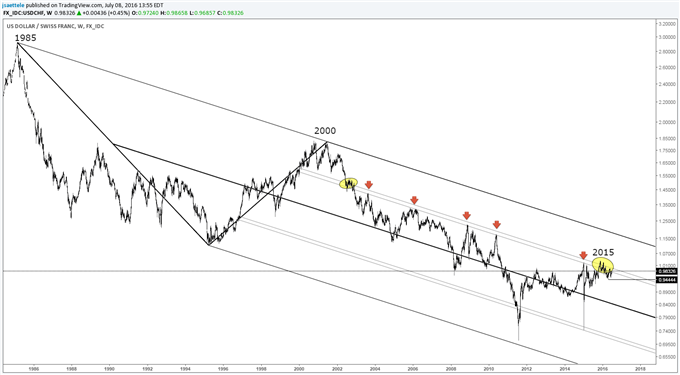
Chart Prepared by Jamie Saettele, CMT
See REAL TIME trader positioning
-FXTW was following a bullish wedge pattern from the November high. This pattern completed on 5/18. The pattern then failed on 6/6. A failed bullish pattern serves as a bearish warning. In fact, FXTW wrote recently that “a failed wedge would not be a surprise given the struggle at LONG TERM resistance since November.” Weakness below .9440 could usher in a ‘waterfall decline’.
original source


