 FTSE 100
 What’s inside:
- FTSE tags resistance and backs off holding key support in mid-6700s
- Inverse head-and-shoulders forming amid the congestion, but…
- MUST wait for pattern completion and official trigger before taking action
When we looked at the FTSE last Thursday we were looking for the index to struggle as it approached the Aug and Sep peaks, and then dip back lower. So far things are playing out fairly close to script. The pullback so far resulted in a move no lower than the 6700s, and area we had penciled in as support.
The path of flight over the past six weeks is thus far looking consolidative in nature, with potential for an inverse H&S pattern forming amid the congestion. Most often times these formations are regarded as topping and bottoming patterns, but they can also act as a continuation-style pattern when positioned within the context of an ongoing trend.
The pattern hasn’t completed yet. This is important to remember because the pattern won’t be validated until the market breaks out above the neckline. The chart still has enough time and room to become a different formation (triangle/wedge) or nothing at all; that is why it is important to wait for a breakout from any technical pattern before becoming aggressive.
For a more symmetrical inverse H&S, it would be best to see a little more work on the right side of the pattern, filling out the right shoulder. But nevertheless, it’s still close enough to be considered a valid formation should it close above the neckline. A closing price above 6939/56 will set the pattern in motion.
It’s worth keeping in mind, in our experience, that inverted H&S continuation-style formations often times lead to a terminal move before the market in question reverses course. So while it could look good coming out of the gates, we must be cognizant of this should the FTSE rally.
The depth of the pattern (~180 points) points to about 7200 when looking for a target by utilizing measured moves determined by pattern size. We will first have our eyes on the record highs at 7127.
A strong failure back down into the low 6700s will severely dent pattern potential and alternatives will need to be examined.
FTSE 100 Daily
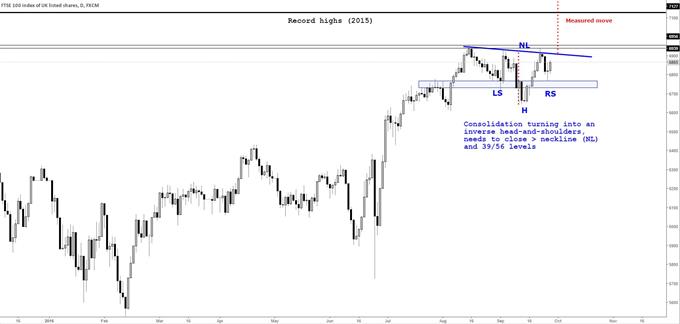
Created using Tradingview
Improve your technical analysis skills by reading through our free trading guides designed to help traders of all experience levels.
---Written by Paul Robinson, Market Analyst
If you would like to receive Paul’s analysis directly via email, please sign up here.
You can follow Paul on Twitter at @PaulRobinsonFX.
original source


