Talking Points:
- US Dollar Aims to Renew Advance Following Pullback
- S&P 500 Corrects Higher But Topping Pattern is Intact
- Crude Oil Sinks to 1-Month Low, Gold May Turn Lower
Can’t access the Dow Jones FXCM US Dollar Index? Try the USD basket on Mirror Trader. **
US DOLLAR TECHNICAL ANALYSIS – Prices rebounded as expected after putting in a Bullish Engulfing candle pattern at support set from October 2013. A shallow pullback looks corrective in the context of the upside breakout that cleared resistance at the top of a falling channel set from early June. A daily close above resistance at 10431, the 38.2% Fibonacci retracement, targets the 50% level at 10452. Alternatively, a turn back below channel top resistance-turned-support at 10388 exposes a triple bottom in the 10354-75 area.
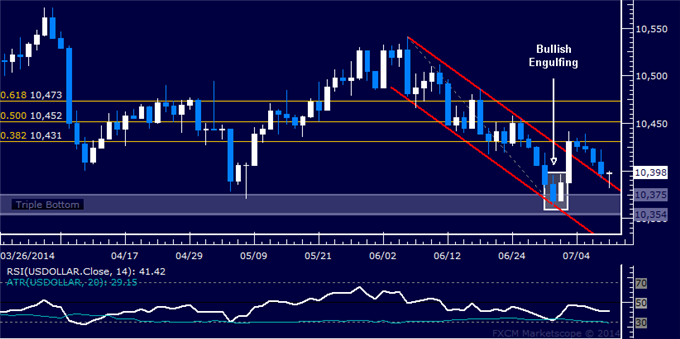
Daily Chart - Created Using FXCM Marketscope 2.0
** The Dow Jones FXCM US Dollar Index and the Mirror Trader USD basket are not the same product.
S&P 500 TECHNICAL ANALYSIS – Prices fell as expected after putting in a bearish Evening Star candlestick pattern at the top of a rising channel set from mid-April. A break below the 14.6% Fibonacci retracement at 1960.10 on a daily closing basis exposes the 23.6% level at 1944.20. Near-term trend line support-turned-resistance is at 1980.50, followed by the July 3 highat 1985.90.
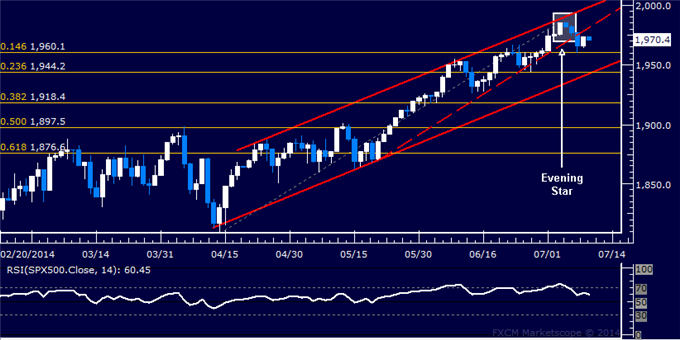
Daily Chart - Created Using FXCM Marketscope 2.0
GOLD TECHNICAL ANALYSIS – Prices remain in consolidation move above resistance at 1333.47, the July 1 high. Negative RSI divergence warns a turn lower may be ahead. Near-term support is at 1318.55, marked by a rising trend line set from early June. A break below that on a daily closing basis initially exposes the 23.6% Fibonacci retracementat 1311.47.
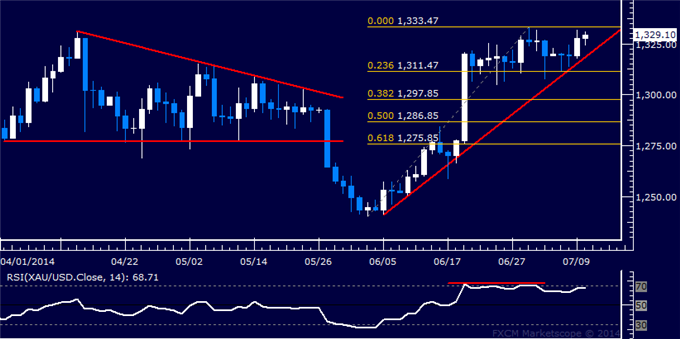
Daily Chart - Created Using FXCM Marketscope 2.0
CRUDE OIL TECHNICAL ANALYSIS – Prices broke support at 102.13, the 61.8% Fibonacci retracement, exposing the 76.4% level at 100.83. A further push below that exposes the May 1 low at 98.73. Alternatively, a reversal back above 102.13 aims for the 50% retracement at 103.13.
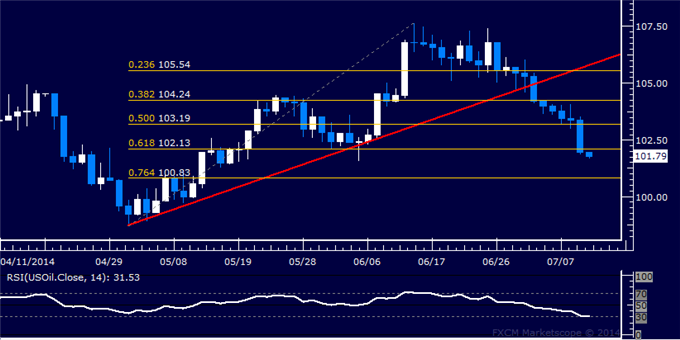
Daily Chart - Created Using FXCM Marketscope 2.0
--- Written by Ilya Spivak, Currency Strategist for DailyFX.com
To receive Ilya's analysis directly via email, please SIGN UP HERE
Contact and follow Ilya on Twitter: @IlyaSpivak
original source


