- EURUSD headed to 1.20?
- GBPUSD crosses above 52 week average
- USDJPY may have made an important top
--Subscribe to Jamie Saettele's distribution list in order to receive a free report to your inbox several times a week.
--For more analysis and trade setups (including current positions and the ‘watchlist’, visit SB Trade Desk
EUR/USD
Weekly
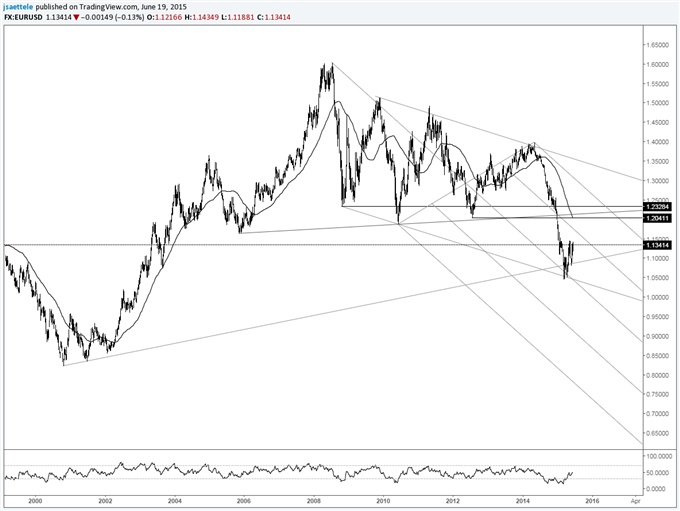
Chart Prepared by Jamie Saettele, CMT
Automate trades with Mirror Trader
-“Several longer term technical observations are worthy of note; the rate found low at an important long term level (line off of 2008 and 2010 lows) and the ownership profile (as per COT) is at a record. The speculative crowd has never been more bearish…ever. Such conditions typically precede important reversals.”
-Since the March low, EURUSD has rallied sharply and declined sharply. The decline from the May high ended near the 61.8% retracement of the March-May advance. Daily RSI briefly poked above 70 at the May high and bottomed at 40 at the May low. These observations are consistent with a sideways market at worst and possibly the early stages of a larger rally. Even a test of the major breakdown level would result in a move to 1.20.
GBP/USD
Weekly
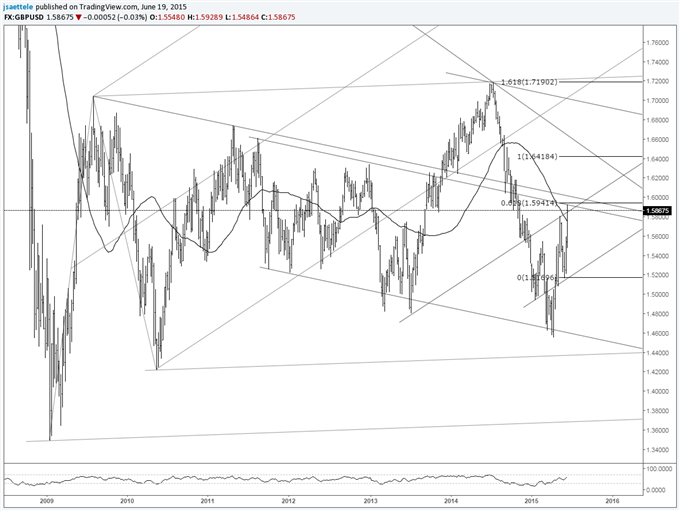
Chart Prepared by Jamie Saettele, CMT
Automate trades with Mirror Trader
-GBPUSD has broken above its 52 week average for the first time since September 2013. There are hurdles to clear from slope resistance (on various time frames) up to about 1.60. As such, a period of consolidation below 1.60 may be in store before an attempt on 1.64+ (2 equal legs from the April low).
AUD/USD
Weekly
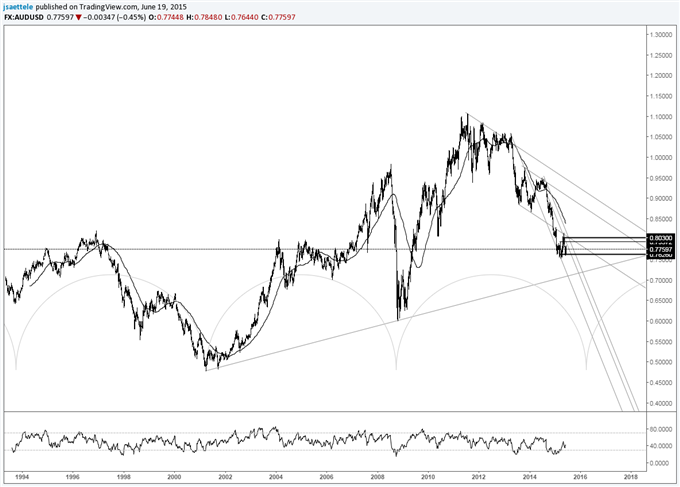
Chart Prepared by Jamie Saettele, CMT
Automate trades with Mirror Trader
-A slope confluence pinpointed the May high, which keeps the broader trend pointed lower. A long term level to be aware of in AUDUSD is the line that connects the 2001 and 2008 lows, which is near .7100. Be aware that the range that has been underway since April could persist for months and morph into a triangle or flat pattern.
NZD/USD
Weekly
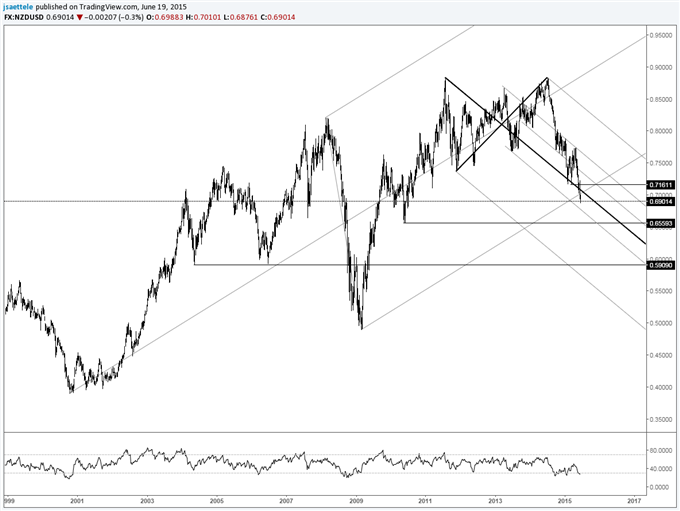
Chart Prepared by Jamie Saettele, CMT
Automate trades with Mirror Trader
-“One can’t help but notice that an epic double top is possible with a target of .5898. That would trigger on a drop below .7370.”
-“A bearish wedge pattern has formed and yields an objective of .6607.” Look towards the mentioned objective as long as price is below .7230. A weekly close above .7050 would warn of a bottoming attempt.
USD/JPY
Weekly
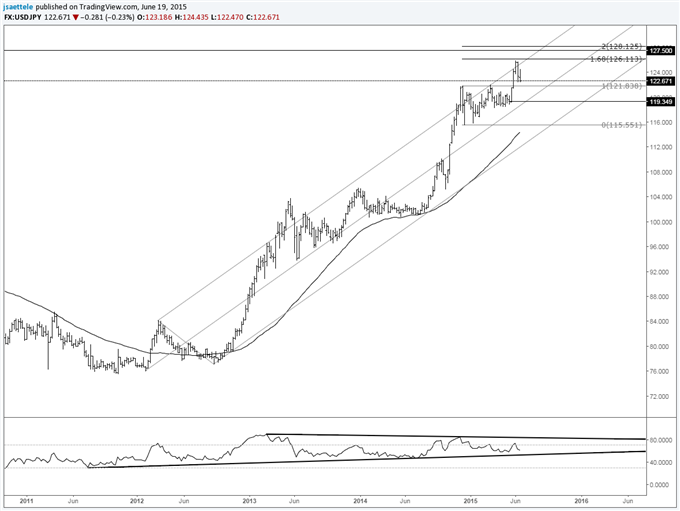
Chart Prepared by Jamie Saettele, CMT
Automate trades with Mirror Trader
-“A USDJPY breakout from the 6 month coil would open up 123.16-124.13 (high close from June 2007 and 2007 high). A measured objective from the pattern yields 125.72 and 128.12.”
-USDJPY ended up trading to 125.85 (the mentioned 125.72 was the December range x .618 + the December high…basically a Fibonacci range expansion). Failure at long term uptrend resistance indicates potential for an important top to form.
USD/CAD
Weekly
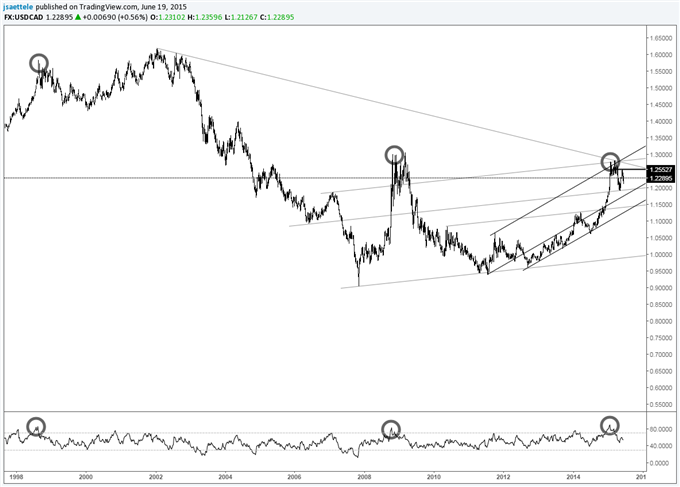
Chart Prepared by Jamie Saettele, CMT
Automate trades with Mirror Trader
-“A broader range may in store. In fact, weekly RSI recorded its 2nd highest reading ever in Jan (only higher reading was in 1984). Other high periods led to extended periods of sideways trading. The failed run at a high volume level (1.2560) twice warns of additional range trading.” Levels to pay attention to within the range are 1.2160 and 1.2430.
USD/CHF
Weekly
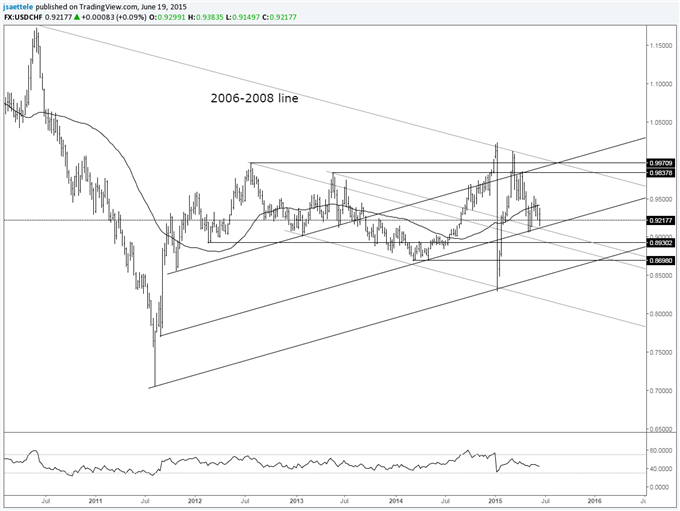
Chart Prepared by Jamie Saettele, CMT
Automate trades with Mirror Trader
-Is USDCHF leading? Lower highs and lower lows since February along with a bearish daily RSI profile indicate potential for something bigger on the downside (think .8600). USDCHF also continues to respect near term slope. A push above the 5/17 high at .9542 would shift focus higher towards .9971.
original source


