To receive Ilya's analysis directly via email, please SIGN UP HERE
Talking Points:
- GBP/USD Technical Strategy: Flat
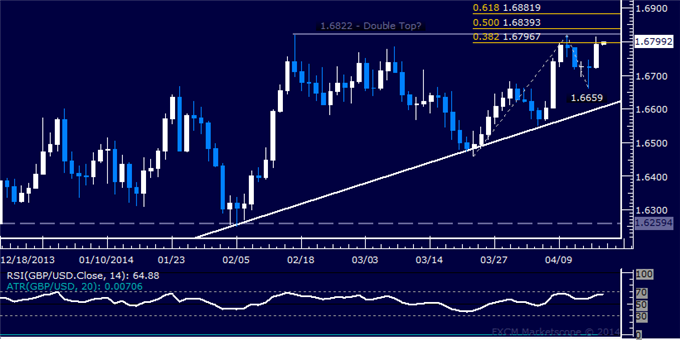
- Support:1.6659 (Apr 15 low), 1.6606 (trend line)
- Resistance: 1.6797 (38.2% Fib exp.), 1.6822-39 (Feb 17 high, 50% Fib exp.)
The British Pound launched a sharp recovery against the US Dollar but an Evening Star candlestick pattern continues to warn of topping ahead. Initial resistance is at 1.6797, the 38.2% Fibonacci expansion, with a break above that exposing the 1.6822-39 area marked by the 50% level and the February 17 high. Near-term support is at 1.6659, the April 15 low, followed by a rising trend line set from mid-November 2013 (now at 1.6606)
While the Evening Star pattern remains technically valid absent a daily close above its high (1.6820), entering short here seems ill-advised given the strong momentum behind yesterday’s advance. On the other hand, a long trade is unattractive from a risk/reward perspective with prices squarely at near-term resistance. We will continue to monitor developments from the sidelines for now.
Confirm your chart-based trade setups with the Technical Analyzer. New to FX? Start Here!
Daily Chart - Created Using FXCM Marketscope 2.0
--- Written by Ilya Spivak, Currency Strategist for DailyFX.com
original source


