To receive Ilya's analysis directly via email, please SIGN UP HERE
Talking Points:
- GBP/USD Technical Strategy: Flat
- Support: 1.7062, 1.6991, 1.6934
- Resistance:1.7173, 1.7243, 1.7301
The British Pound may be carving out a top against the US Dollar as prices show a Hanging Man candlestick coupled with negative RSI divergence. A break below the 23.6% Fibonacci retracement at 1.7062 on a daily closing basis initially exposes the 38.2% level at 1.6991. Alternatively, a reversal above the 23.6% Fib expansion at 1.7173 opens the door for a test of the 38.2% threshold at 1.7243.
Current positioning looks inconclusive. On one hand, bearish reversal cues remain intact, arguing against taking up the long side. On the other, downside follow-through has yet to materialize in a meaningful way. We will remain on the sidelines for now, waiting for greater clarity to emerge.
Add these technical levels directly to your charts with our Support/Resistance Wizard app!
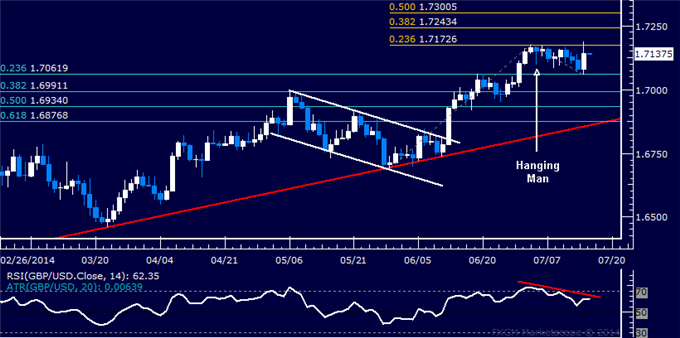
Daily Chart - Created Using FXCM Marketscope 2.0
--- Written by Ilya Spivak, Currency Strategist for DailyFX.com
original source


