Talking Points:
- US Dollar Bounce Leaves Downswing Warning Intact for Now
- S&P 500 Continues to Flat-Line as Prices Await Direction Cues
- Crude Oil Chart Setup Hints at Bounce, Gold Stalls Sub-$1200
Can’t access the Dow Jones FXCM US Dollar Index? Try the USD basket on Mirror Trader. **
US DOLLAR TECHNICAL ANALYSIS – Prices appear vulnerable to a correction lower having produced a bearish Dark Cloud Cover candlestick pattern. Negative RSI divergence bolsters the case for a downside scenario. A daily close below the 14.6% Fibonacci expansion at 11263 exposes the 23.6% Fib retracement at 11227. Alternatively, a move above the 23.6% expansion at 11298 opens the door for a challenge of the 38.2% threshold at 11354.
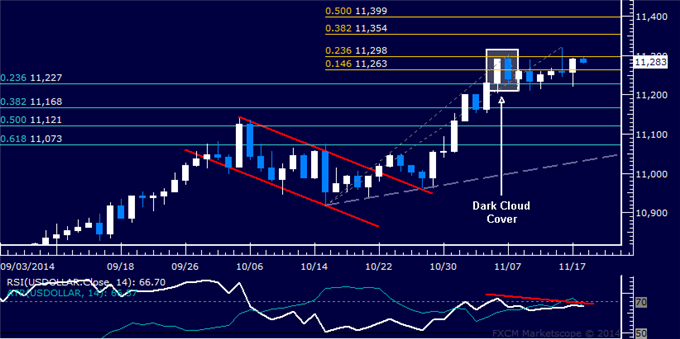
Daily Chart - Created Using FXCM Marketscope 2.0
** The Dow Jones FXCM US Dollar Index and the Mirror Trader USD basket are not the same product.
S&P 500 TECHNICAL ANALYSIS – Prices are treading water after setting yet another record high last week. Near-term resistance is at 2051.00, the 23.6% Fibonacci expansion, with a break above that on a daily closing basis exposing the 38.2% level at 2081.20. Alternatively, a reversal below the 14.6% Fib at 2032.30 aims for resistance-turned-support at 2022.10, the September 19 high.
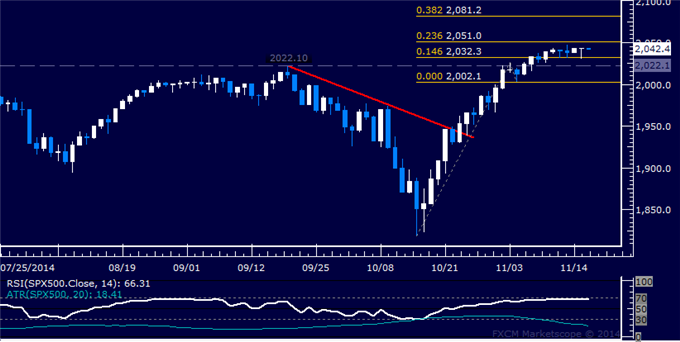
Daily Chart - Created Using FXCM Marketscope 2.0
GOLD TECHNICAL ANALYSIS – Prices are attempting to launch a recovery, with a break above support-turned-resistance marked by the October 3 low at 1189.89 exposing the 38.2% Fibonacci retracement at 1212.23. Alternatively, a reversal below the 1178.86-80.84 area (December 2013 low, 23.6% level) targets the 14.6% retracement at 1161.49.
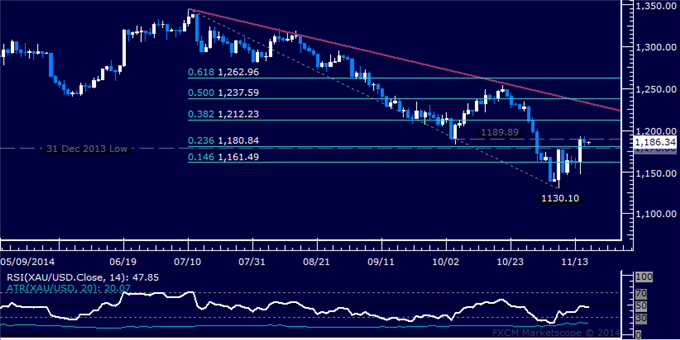
Daily Chart - Created Using FXCM Marketscope 2.0
CRUDE OIL TECHNICAL ANALYSIS – Prices may be gearing up for a recovery after putting in a bullish Piercing Line candlestick pattern. A break above the 14.6% Fibonacci retracement at 79.81 exposes the intersection of a falling trend line and the 23.6% level at 81.71. Near-term support is at 76.74, the November 14 low.
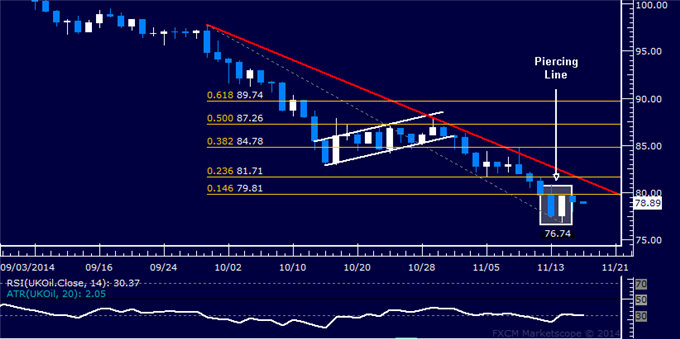
Daily Chart - Created Using FXCM Marketscope 2.0
--- Written by Ilya Spivak, Currency Strategist for DailyFX.com
To receive Ilya's analysis directly via email, please SIGN UP HERE
Contact and follow Ilya on Twitter: @IlyaSpivak
original source


