To receive James Stanley’s Analysis directly via email, please sign up here.
Talking Points:
- Gold Technical Strategy: Flat, top-side reversal setup identified
- As USD strength continues at a break-neck pace, Gold has fallen below numerous support levels.
- Last week’s aggressive price action in Gold prices may offer reversal setups in the week ahead.
In our last article, we looked at the precipitious drop in Gold prices as a faster-than-expected rate hike out of the Federal Reserve was illiciting USD-strength through markets. After tapping a new short-term high at the $1,190 level only three weeks ago, prices have peeled off over $100 in short order as the Greenback has ascended to a new 12-year high. The blowout October NFP-print really hastened this move, as investors have continued to price in a higher probability of a Fed hike in December, and this sank Gold to a support level that’s brought in considerable reversal strength in the very recent past.
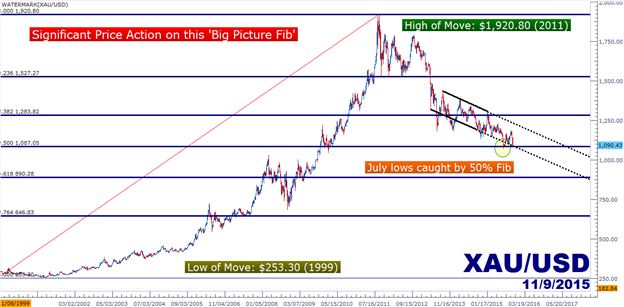
The level in question had helped to mark the lows of July, when prices were extending a trend that had begun in May as Gold lost more than $150/ounce in under two months. This is the 50% Fibonacci retracement of the ‘big picture major move’ in Gold, taking the 1999 low of $253.30 to the 2011 high of $1,920.80; and this places the 50% retracement right at $1,087.05. Notice the yellow circle on the chart, marking the July lows on the monthly chart as this pivotal support level stopped the bleeding, at least temporarily.
Created with Marketscope/Trading Station II; prepared by James Stanley
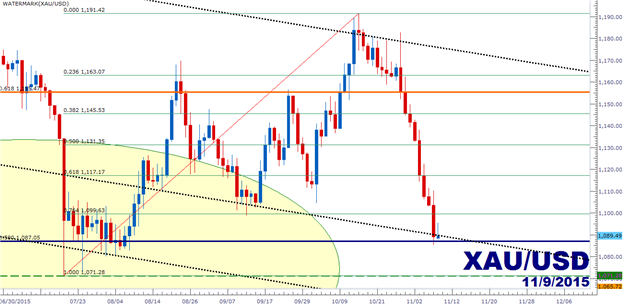
Near-term, this raises a couple of interesting prospects for trade setups moving forward. Most attractive given current technical setup may be the reversal given the prospect of fading a huge move after Gold prices have run into a pivotal support level. Traders can look to place stops below the low that intersected with this Fibonacci support level, and that low on Friday was $1,085.37, with short-term profit targets cast towards $1,100 (major psychological level and 76.4% of the most recent major move), $1,117.17 (61.8% Fib retracement of the same move), and then $1,125 (minor psychological level).
Traders wanting to trade the reversal with a slightly more conservative stance can look to kick stops below that July low of $1,071.28, in which case the initial target would likely need to be wider to offset this additional risk; and $1,117.17 could offer a 1-to-1.5 risk-reward ratio with current prices; $1,125 could function as the secondary target and $1,131.35 could offer a third-target, as this is the 50% Fibonacci retracement of the most recent major move.
On the short-side, traders can trade this move with inside price action or by waiting for a breakout-related entry to the downside. The Friday low of $1,085.37 could serve as the starting gun for short-side breakout entries, with entry orders placed below $1,085 in an effort of avoiding a false-breakout.
Alternatively, traders can use inside price action to wait for a retracement at $1,100 before initiating short positions, with an initial target at $1,087.05, followed by $1,071.28 (2015-low), $1,050 (minor psychological level), and eventually $1,000 (major psychological level).
Created with Marketscope/Trading Station II; prepared by James Stanley
--- Written by James Stanley, Analyst for DailyFX.com
To receive James Stanley’s analysis directly via email, please SIGN UP HERE
Contact and follow James on Twitter: @JStanleyFX
original source


