Talking Points
- USD/JPY surges to a 7-year high
- AUD/USD bounces off key Fib retracement
- Crude closing in on key price zone
Get real time volume on your charts for free. Click HERE
Foreign Exchange Price & Time at a Glance:
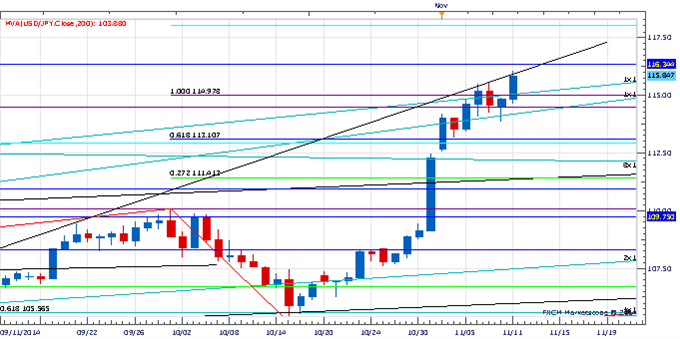
Price & Time Analysis: USD/JPY
Charts Created using Marketscope – Prepared by Kristian Kerr
- USD/JPY surged higher this morning to trade at its highest level in over seven years
- Our near-term trend bias is positive in the exchange rate while over 113.85
- Interim resistance is eyed around 116.30 ahead of the 200% extension of the early October decline at 118.00
- A minor turn window is eyed Wednesday/Thursday
- Weakness under 113.85 would turn us negative on the exchange rate
USD/JPY Strategy: Like the long side while over 113.85.
Instrument | Support 2 | Support 1 | Spot | Resistance 1 | Resistance 2 |
USD/JPY | *113.85 | 115.00 | 115.80 | 116.30 | *118.00 |
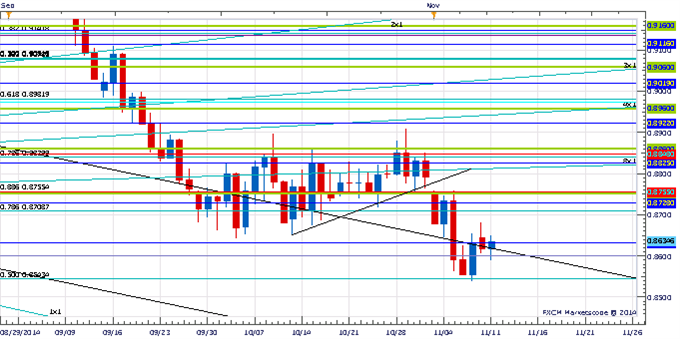
Price & Time Analysis: AUD/USD
Charts Created using Marketscope – Prepared by Kristian Kerr
- AUD/USD fell to new lows for the year last week before finding support at the 50% retracement of the 2008-2011 advance in the .8545 area
- Our near-term trend bias is lower in the Aussie while under .8680
- A close under .8545 is needed to set off the next meaningful leg lower
- A minor turn window is eyed early next week
- A close over .8680 would undermine the immediate negative tone in AUD/USD
AUD/USD Strategy: Like the short side while under .8680.
Instrument | Support 2 | Support 1 | Spot | Resistance 1 | Resistance 2 |
AUD/USD | *.8545 | .8590 | .8635 | *.8680 | .8760 |
Focus Chart of the Day: Crude
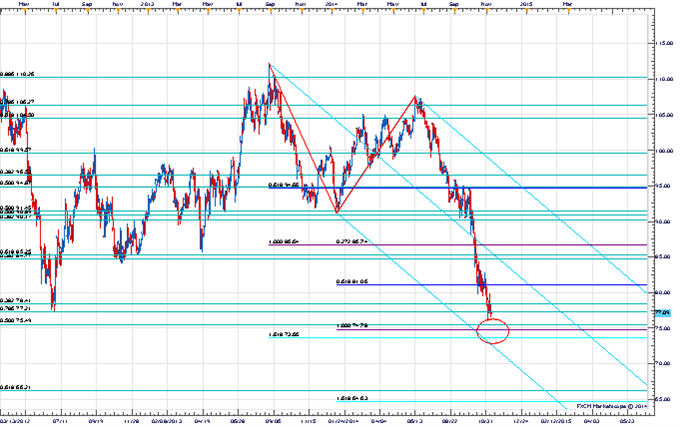
Crude has been remarkably weak since peaking out around the Pi cycle turn window this past June (Read HERE). Upside corrections have all been modest and few and far between. With sentiment back at extremes (DSI at 8% bulls on Monday) the contrarian in us can’t help but wonder if the commodity is getting a bit over “hated” on and nearing some sort of counter-trend reprieve. The key price inflection point coming up looks to between $75.50 and $73.50 a barrel as this marks a nice convergence of the 50% retracement of the 2008-2011 advance, the 200% extension of the 1H14 range, the 161.8% projection of the late 2013 decline and a median line connecting the 2013 and 2014 highs. If oil is going to meaningfully bounce one would expect it to occur from somewhere around this price zone (perhaps a couple dollars lower as it is Crude after all!) . Failure to find support around this confluence will open the door to a slide into the mid-60’s.
To receive Kristian’s analysis directly via email, please SIGN UP HERE.
This publication attempts to further explore the concept that mass movements of human psychology, as represented by the financial markets, are subject to the mathematical laws of nature and through the use of various geometric, arithmetic, statistical and cyclical techniques a better understanding of markets and their corresponding movements can be achieved.
--- Written by Kristian Kerr, Senior Currency Strategist for DailyFX.com
To contact Kristian, e-mail kkerr@fxcm.com. Follow me on Twitter @KKerrFX
original source


