Talking Points
- Price & Time covers key technical themes daily and can be delivered to your inbox each morning by joining the distribution list:Price & Time
- EUR/USD cracks multi-month range highs
- USDOLLAR tests key Fibo
Get real time volume on your charts for free. Click HERE
Foreign Exchange Price & Time at a Glance:
Price & Time Analysis: EUR/USD
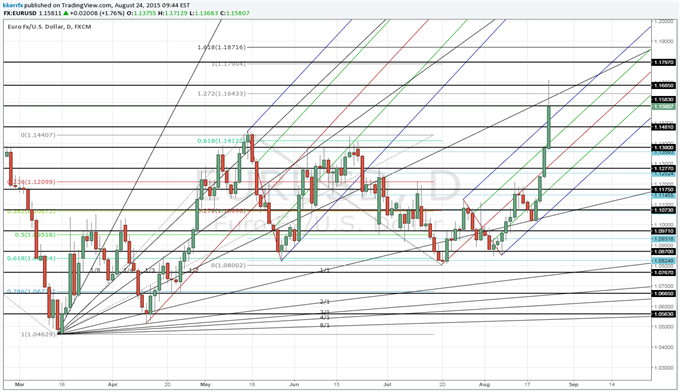
ChartPrepared by Kristian Kerr
- EUR/USD traded at its highest level since mid-January today
- Our near-term trend bias is positive while above 1.1375
- The 12th square root relationship of the year-to-date low at 1.1685 is immiediate resistance ahead of the of a longer-term Fibonacci attraction around 1.1800
- A very minor turn window is eyed Tuesday/Wednesday
- A daily close below 1.1375 would turn us negative on the euro again
EUR/USD Strategy: Like the long side while above 1.1375.
Instrument | Support 2 | Support 1 | Spot | Resistance 1 | Resistance 2 |
EUR/USD | *1.1375 | 1.1480 | 1.1575 | 1.1685 | 1.1800 |
Price & Time Analysis: USDOLLAR
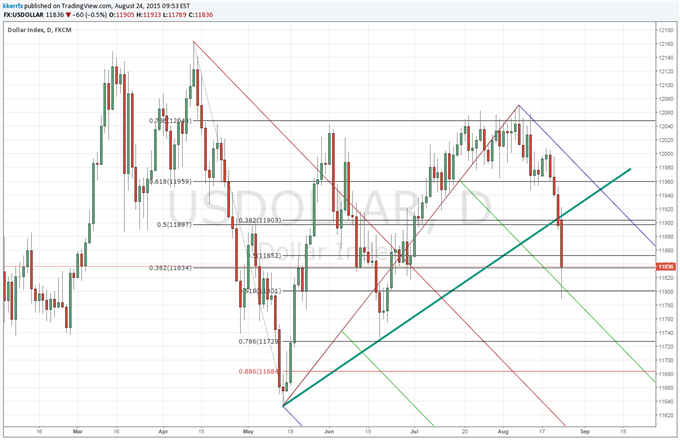
ChartPrepared by Kristian Kerr
- USDOLLAR came under further aggressive weakness on Monday to trade at its lowest level since mid-June
- Our near-term trend bias is now negative on the index
- The 61.8% retracement of the May/August advance around 11,800 is the next key downside pivot with weakness below needed to set off a new leg down
- Another minor turn window is eyed around the middle of the week ahead of a more significant one next week
- A daily settlement back over 11,925 would turn us positive on the index
USDOLLAR Strategy: Like selling on strength into the middle of the week as long as 11,925 holds
Instrument | Support 2 | Support 1 | Spot | Resistance 1 | Resistance 2 |
USDOLLAR | 11,765 | *11,800 | 11,840 | 11,850 | *11,925 |
Focus Chart of the Day: Dow 30 Weekly
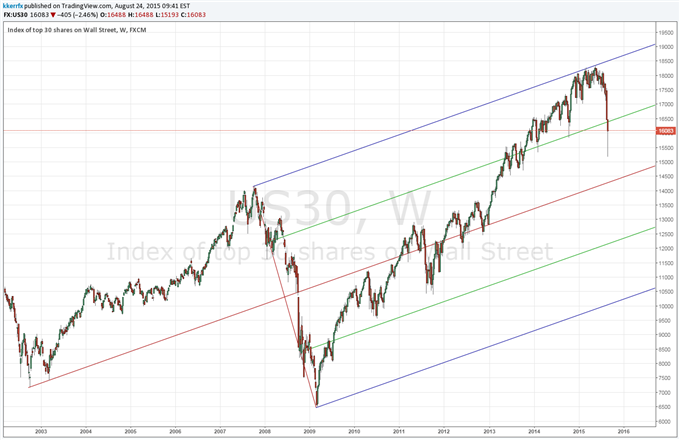
With the Shanghai Composite Index falling more than 8% overnight, the Nikkei 225 cracking its 200-day moving average and NASDAQ 100 futures trading limit down there is not surprisingly plenty of attention this morning on global equity markets. The Dow Jones Industrial Average is perhaps the most interesting chart in the US. I don’t tend to spend too much time charting the Dow as it is a price weighted index, but at times it can be quite insightful. A simple Andrews’ Pitchfork drawn from the 2002 low in the Dow and connecting the 2007 and 2009 extremes looks to be having quite an influence on the market. The index peaked against the upper parallel in May after finding support last fall around the mid-parallel near 15,900. This morning we have taken out both (i.e. the mid-parallel and last October’s low). On the face of it, this suggests the market is susceptible to an eventual test of the median line currently around 14,200. Complicating the picture is the timing variable. A host of different cyclical relationships (some going back as far back as 1929) should begin to influence later this week. With the market seemingly in free fall leading up to it, the odds are starting to climb on this window being some sort of meaningful low (or possibly a back test after the action in the 1st hour of cash trading). Sentiment seems to support this interpretation as the DSI fell to just 4% bulls on Friday afternoon. Historically a reliable contrarian red flag. Weakness past the first week of September and all bets are off.
To contact Kristian, e-mail kkerr@fxcm.com. Follow me on Twitter @KKerrFX
This publication attempts to further explore the concept that mass movements of human psychology, as represented by the financial markets, are subject to the universal laws of nature and through the use of various geometric, arithmetic, statistical and cyclical techniques a better understanding of markets and their corresponding movements can be achieved.
original source


