Talking Points
- Aussie nearing key attraction/reaction zone
- EUR/USD stalls at Gann resistance
- Gold breaks key Fib level
Get real time FXCM volume on your charts for free. Click HERE
Foreign Exchange Price & Time at a Glance:
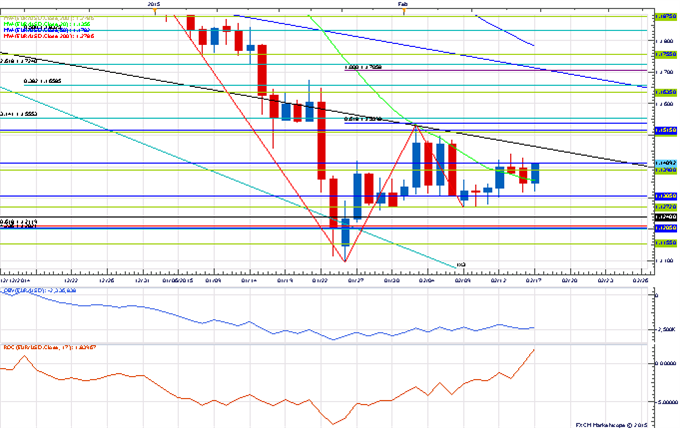
Price & Time Analysis: EUR/USD
Charts Created using Marketscope – Prepared by Kristian Kerr
- EUR/USD remains in consolidation mode near the 3rd square root relatinship of the year’s low
- Our near-term trend bias remains positive while above 1.1315
- Interim resistance is seen around 1.1445, but a move through 1.1515 is really needed to signal that a more meaningful extension higher is underway
- An important turn window is eyed today
- A close below 1.1315 would turn us negative on the exchange rate
EUR/USD Strategy: Like holding only a reduced long positions while above 1.1315. Will look to go short on a move below 1.1260.
Instrument | Support 2 | Support 1 | Spot | Resistance 1 | Resistance 2 |
EUR/USD | 1.1315* | 1.1360 | 1.1370 | 1.1445 | *1.1515 |
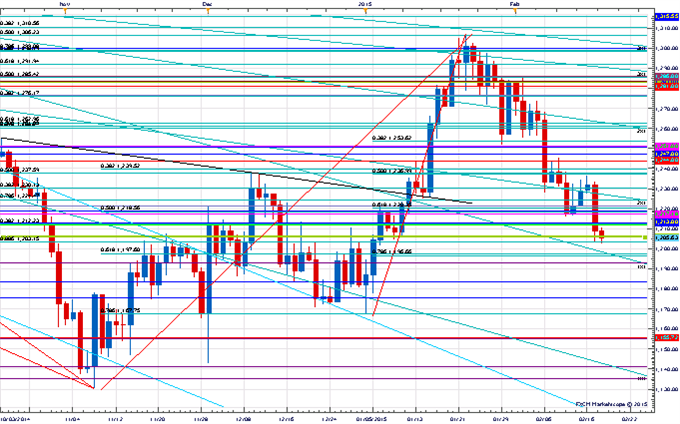
Price & Time Analysis: GOLD
Charts Created using Marketscope – Prepared by Kristian Kerr
- GOLD fell to its lowest level in a month and a half this morning
- Our near-term trend bias is negative while below 1238
- The 78.6% retracement of the year’s range at 1196 is the next important downside attraction with a break below needed to force the next extension lower
- A minor turn window is seen here
- A close above 1238 would turn us positive on the metal
GOLD Strategy: Like the short side while 1238 holds.
Instrument | Support 2 | Support 1 | Spot | Resistance 1 | Resistance 2 |
GOLD | 1183 | *1196 | 1205 | 1220 | *1238 |
Focus Chart of the Day: AUD/USD
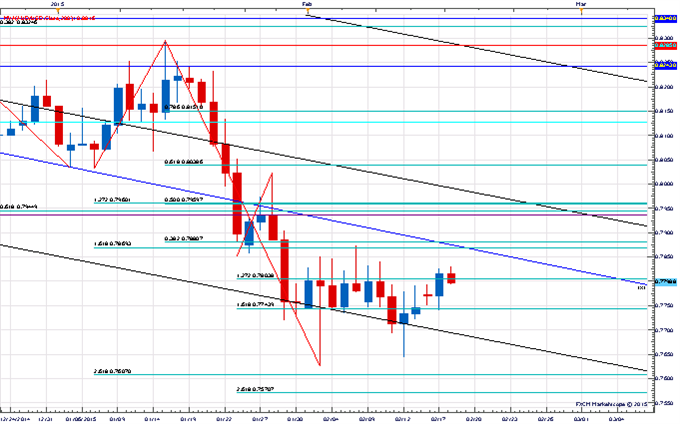
The near term technical picture in AUD/USD has muddied a bit over the past few trading days with the pair’s failure to crack the year’s low at .7625 last week. The subsequent ‘higher low’ on the daily chart is a clear warning sign that the downtrend is fatiguing. That said, no real technical damage has been inflected on the broader downtrend as of yet. The key price zone for us looks to be the .7870/85 area as this marks a nice convergence of several important levels of resistance including the month-to-date high, 38% retracement of the year’s range and the 3rd square root relationship of the year’s low. This area also could be interpreted as the trigger for a potential ‘double bottom’ pattern. While below this area we have to give the benefit of the doubt to the broader trend. Traction above .7885, however, would warn that a more meaningful correction higher is beginning to take hold.
To receive Kristian’s analysis directly via email, pleaseSIGN UP HERE.
This publication attempts to further explore the concept that mass movements of human psychology, as represented by the financial markets, are subject to the mathematical laws of nature and through the use of various geometric, arithmetic, statistical and cyclical techniques a better understanding of markets and their corresponding movements can be achieved.
--- Written by Kristian Kerr, Senior Currency Strategist for DailyFX.com
To contact Kristian, e-mail kkerr@fxcm.com. Follow me on Twitter @KKerrFX
original source


