Talking Points
- 1.3570 a key level for the euro
- AUD/USD fails at key Gann level
- USD/JPY entering into critical cyclical period
New to Currency Trading? Learn More HERE
Foreign Exchange Price & Time at a Glance:
Price & Time Analysis: EUR/USD
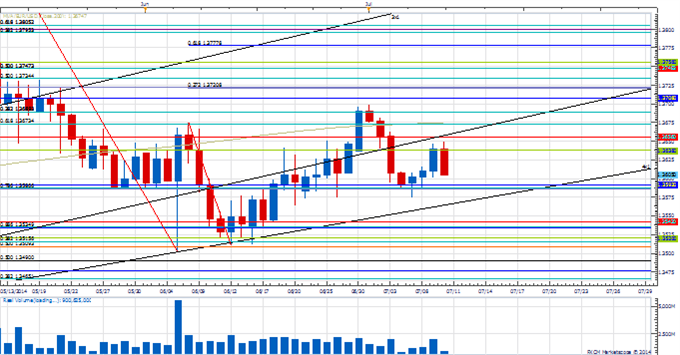
Charts Created using Marketscope – Prepared by Kristian Kerr
- EUR/USD remains in a sideways to higher range
- Our near-term trend bias is lower in the euro while under 1.3650
- A move under 1.3570 is needed to set up a test of more important support levels near 1.3500
- A minor cycle turn window is eyed early next week
- Strenght over 1.3650 will re-focus higher
EUR/USD Strategy: Like the short side whilst below 1.3650.
Instrument | Support 2 | Support 1 | Spot | Resistance 1 | Resistance 2 |
EUR/USD | *1.3570 | 1.3590 | 1.3610 | *1.3650 | 1.3690 |
Price & Time Analysis: AUD/USD
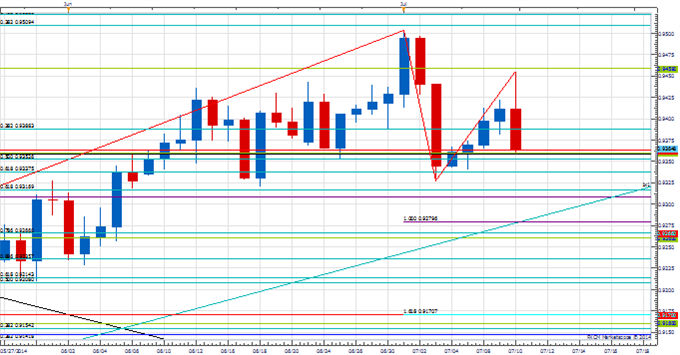
Charts Created using Marketscope – Prepared by Kristian Kerr
- AUD/USD traded to its highest level in three months today before reversing sharply lower from the 8th square root relationship of the year’s low at .9560
- Our near-term trend bias is now lower in the Aussie
- Last week’s closing low at .9345 is now a critical pivot with weakness below needed to confirm the start of a more meaningful move lower
- A minor cycle turn window is eyed early next week
- A daily close over .9460 would turn us bullish on the Aussie
AUD/USD Strategy: Like selling on strength against .9460
Instrument | Support 2 | Support 1 | Spot | Resistance 1 | Resistance 2 |
AUD/USD | *.9345 | .9360 | .9365 | .9405 | *.9460 |
Focus Chart of the Day: USD/JPY
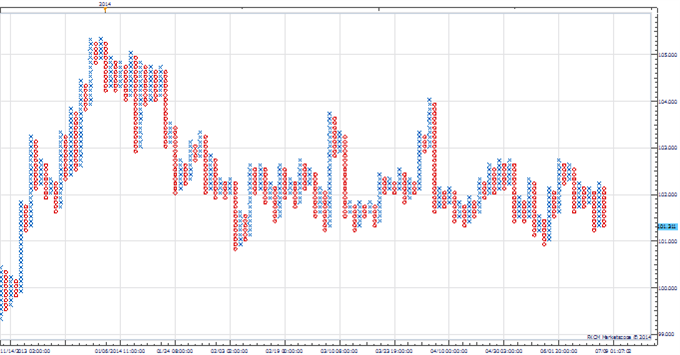
USD/JPY is testing multi-week lows this morning and things are getting interesting in the exchange rate or are they? A charting method designed to filter out as much noise as possible is Point & Figure. The 3-box/30 pip reversal chart (box size=10 pips) in USD/JPY highlights the absolute lack of volatility in the rate this year very well. From this perspective we still have a ways to go to get to make or a break levels as it would take a move to 100.70 to signal any real breakdown. On the top side the 102.80 is a clear congestion area, but the P&F methodology suggests that a move over 103.40 (trendline) is really needed to signal a resumption of the long-term uptrend. Our cyclical work suggests that USD/JPY is in the latter stages of this consolidation and we think is should ultimately resolve itself in a move higher. However, a final low could still be a week or two away and we like preserving mental capital and waiting for at least 102.80 to get paid before positioning. Under 100.70 and all near-term bets are off.
To receive Kristian’s analysis directly via email, please SIGN UP HERE.
This publication attempts to further explore the concept that mass movements of human psychology, as represented by the financial markets, are subject to the mathematical laws of nature and through the use of various geometric, arithmetic, statistical and cyclical techniques a better understanding of markets and their corresponding movements can be achieved.
--- Written by Kristian Kerr, Senior Currency Strategist for DailyFX.com
To contact Kristian, e-mail kkerr@fxcm.com. Follow me on Twitter @KKerrFX
original source


