What's inside:
- S&P 500 bounces from trustworthy level of support, but...
- Reasons to believe support may not hold for long
- Short-term levels outlined
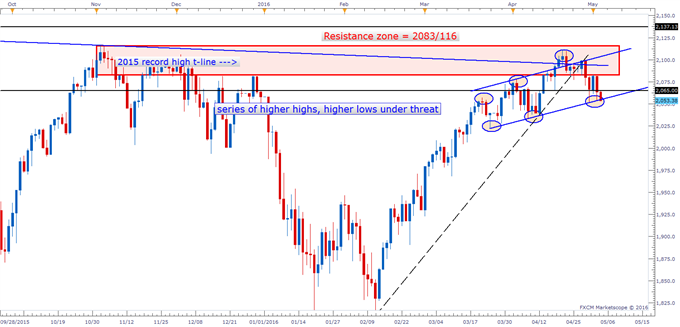
The S&P 500 (FXCM: SPX500) found buyers yesterday at what had become a trustworthy slope of support. This prompted a bounce, but how much “oomph” the market has following that test will determine for how long we can trust the underside trend-line. Not showing much so far in overnight futures trade.
It’s twin line up above did a very good job of keeping the S&P contained (unsurprising given it came at the upper-bounds of the 2083/116 resistance zone.) The number of touches was impressive, nevertheless, which gives further importance to the lower line of support. If the S&P and Dow are ready to join their weaker sibling, the Nasdaq 100, then it may not be long before support gives way – turning it into old support and new resistance.
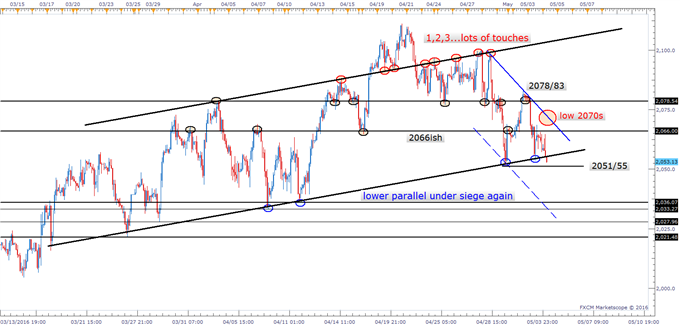
If the S&P can make a strong push off the lower parallel (will need to do so again today) and the Nasdaq 100 (FXCM: NAS100) can find some bidders, then we may have to turn our focus higher. But if the Nasdaq is indeed our little dying canary, then expectations of holding slope support and 2051 will quickly diminish. We will need to see how things play out as we roll on into the cash session (13:30-20:00 GMT).
A strengthening dollar, weakening crude oil (it did have an 80% rally, some more selling is warranted), along with poor seasonality for stocks are among some reasons to be concerned. The economy hovering at a ½ percent above the zero-line isn’t particularly inspiring, either. There are other reasons, but I digress, I'll leave the fundies up to the smart guys. I am most interested in the technical structure described for further guidance on short-term maneuvers; buy support, sell resistance.
Short-term levels of interest: Support around 2055/51, below there then a few swing lows from March and April in the 2030/20s become the focus. On the upside, resistance of interest comes in at around 2066, the trend-line off the 4/28 peak in the low 2070s, then 2078/83, and on a strong push we would then look to 2100.
SPX500 Daily
SPX500 2-hour
If you’re looking for ways to sharpen your trading skills, check out what we have found to be common traits among successful traders.
---Written by Paul Robinson, Market Analyst
You can follow Paul on Twitter @PaulRobinsonFX, or email him directly at probinson@fxcm.com with any questions, comments, or concerns.
original source


