Talking Points:
- US Dollar Attempting to Break Upward to a New 2014 High
- S&P 500 Remains Stuck in Familiar Narrow Trading Range
- Gold Holds Up at Channel Support, Crude Oil May Bounce
Can’t access the Dow Jones FXCM US Dollar Index? Try the USD basket on Mirror Trader. **
US DOLLAR TECHNICAL ANALYSIS – Prices are trying to push higher anew after spiking to set a year-to-date high last week.Near-term resistance is in the 10749-56 area, marked by the January 2014 high and the 123.6% Fibonacci expansion, with a break above that on a daily closing basis exposing the 138.2% level at 10777. Alternatively, a reversal below the 100% Fib at 10703 opens the door for a challenge of the 76.4% expansion at 10657.
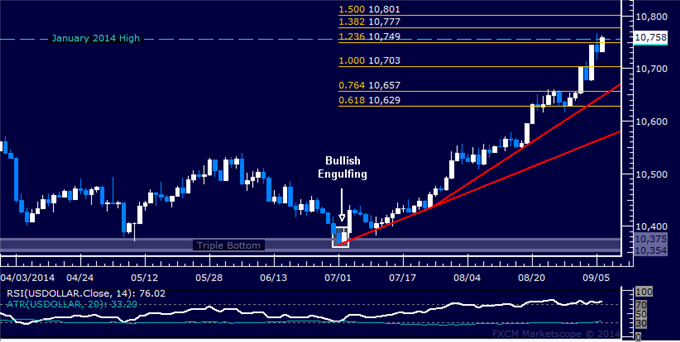
Daily Chart - Created Using FXCM Marketscope 2.0
** The Dow Jones FXCM US Dollar Index and the Mirror Trader USD basket are not the same product.
S&P 500 TECHNICAL ANALYSIS – Prices are testing the 61.8% Fibonacci expansionat 2006.80. A turn lower from here sees near-term support in the 1985.30-91.40 area, marked by the July 24 high and the 50% level, with a break below that on a daily closing basis exposing the 38.2% Fib at 1963.70. Alternatively, a turn above 2006.80 targets the top of the index’s long-term uptrend and the 76.4% expansion at 2033.40.
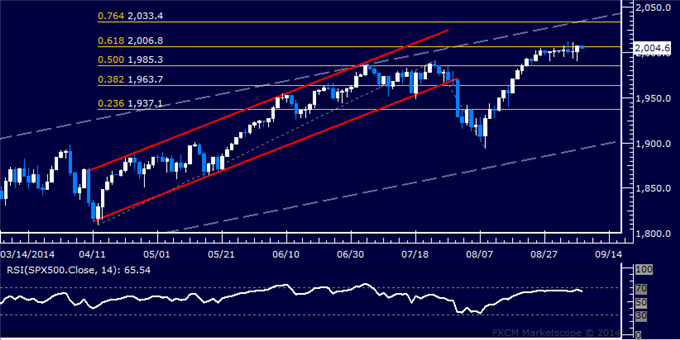
Daily Chart - Created Using FXCM Marketscope 2.0
GOLD TECHNICAL ANALYSIS – Prices are testing resistance at 1269.99, the 14.6% Fibonacci retracement, with a break above that on a daily closing basis exposing the intersection of the 23.6% level and a rising trend line set from December 2013 in the 1277.90-79.35. Falling channel support is now at 1259.45.
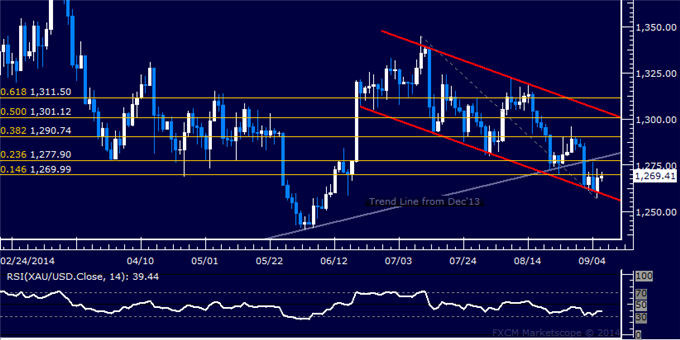
Daily Chart - Created Using FXCM Marketscope 2.0
CRUDE OIL TECHNICAL ANALYSIS – Prices put in a bullish Piercing Line candlestick pattern, hinting a rebound may be ahead. A break above the 14.6% Fibonacci retracement at 102.42 exposes the 23.6% level at 103.82. Alternatively, a move below the 99.91-100.15 area marked by the September 2 low and the 23.6% Fib expansion targets the 38.2% threshold at 97.77.
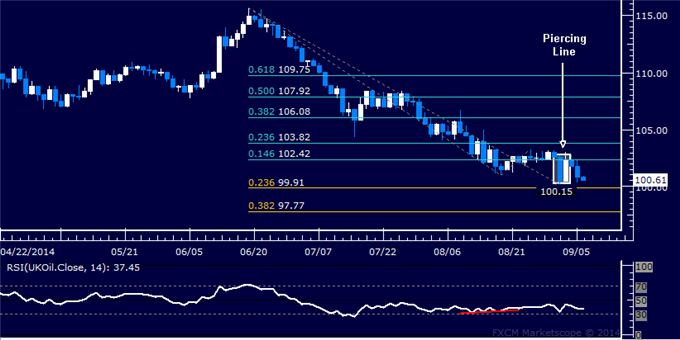
Daily Chart - Created Using FXCM Marketscope 2.0
--- Written by Ilya Spivak, Currency Strategist for DailyFX.com
To receive Ilya's analysis directly via email, please SIGN UP HERE
Contact and follow Ilya on Twitter: @IlyaSpivak
original source


