Talking Points:
- US Dollar Awaits Direction Cues Having Set 4-Month High
- S&P 500 Vulnerable to Deeper Losses After Support Break
- Crude Oil Sellers Continue to Challenge March Swing Low
Can’t access the Dow Jones FXCM US Dollar Index? Try the USD basket on Mirror Trader. **
US DOLLAR TECHNICAL ANALYSIS – Prices are consolidating gains after turning higher as expected having put in a Bullish Engulfing candle pattern. A daily close above resistance at 10560, the 50% Fibonacci retracement, exposes the 61.8% level at 10606. Alternatively, a turn back below resistance-turned-support in the 10513-27 area marked by the May 28 high and 38.2% Fib clears a path for a challenge of 10481, the intersection of a horizontal pivot in play since April and a rising trend line established from the July 1 low.
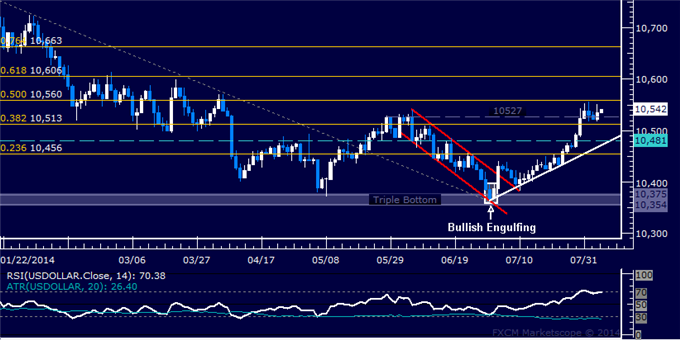
Daily Chart - Created Using FXCM Marketscope 2.0
** The Dow Jones FXCM US Dollar Index and the Mirror Trader USD basket are not the same product.
S&P 500 TECHNICAL ANALYSIS – Prices declined as expected after putting in a bearish Evening Star candlestick pattern with negative RSI divergence. A break below the 38.2% Fibonacci retracement at 1921.80 has exposed the 50% level at 1900.30. Moving further below that eyes the 61.8% Fib at 1878.70. Alternatively, a reversal back above 1921.80 opens the door for a test of the 23.6% retracement at 1948.40.
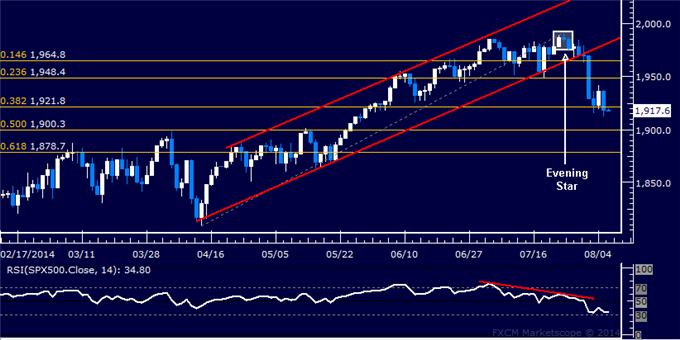
Daily Chart - Created Using FXCM Marketscope 2.0
GOLD TECHNICAL ANALYSIS – Prices put in a bullish Piercing Line candlestick pattern, hinting a move higher may be ahead. Initial resistance is at 1295.37, the 14.6% Fibonacci expansion. A break above that on a daily closing basis exposes the 23.6% level at 1304.81. Near-term support is at 1278.65, marked by the intersection of a horizontal pivot in play since early April and a falling trend line connecting major lows from late June.
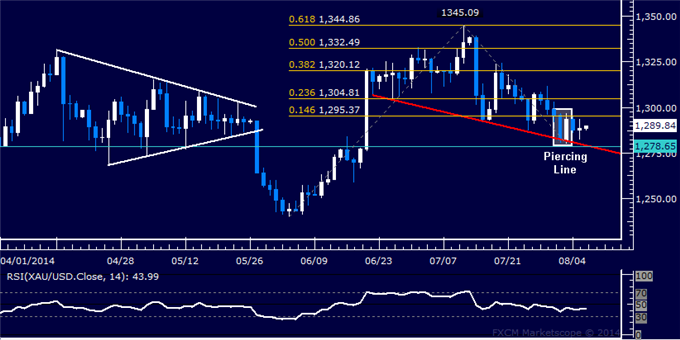
Daily Chart - Created Using FXCM Marketscope 2.0
CRUDE OIL TECHNICAL ANALYSIS – Prices are testing support in the 97.30-34 area, marked by the March 17 low and the 76.4% Fibonacci expansion. A break below that on a daily closing basis exposes a rising trend line set from June 2012, now at 96.40. Alternatively, a reversal above the 61.8% level at 98.56 aims for the 99.00 figure, followed by the 50% Fib at 99.58.
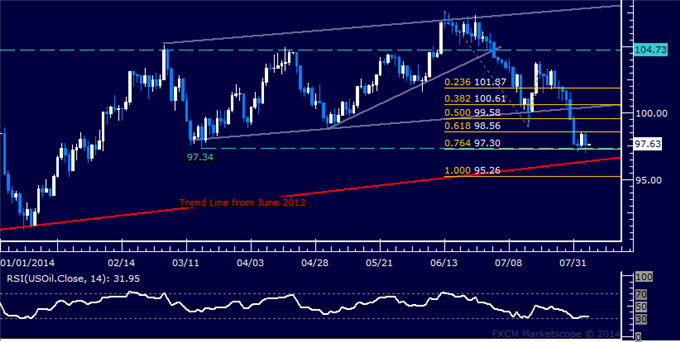
Daily Chart - Created Using FXCM Marketscope 2.0
--- Written by Ilya Spivak, Currency Strategist for DailyFX.com
To receive Ilya's analysis directly via email, please SIGN UP HERE
Contact and follow Ilya on Twitter: @IlyaSpivak
original source


