- US Dollar likely to remain in a tight range until Greece moves
- Forex volatility has pulled back noticeably following uneventful FOMC decision
- Our strategy-trading bias shifts toward our Momentum2 strategy
The US Dollar seems likely to stick to key highs versus the Euro and other counterparts. Here’s why we think so.
A fairly uneventful US Federal Open Market Committee meeting sent the US Dollar lower across the board, and a subsequent drop in FX volatility prices suggests that the Greenback may trade sideways to lower for the foreseeable future.
Indeed the Dollar currently trades near important multi-month lows versus the Euro and has failed to hold previous gains versus the Japanese Yen and Australian Dollar. A relatively quiet week of FX economic event risk leaves little hope of a substantial breakout in either direction, and as such we view that the EUR/USD, USD/JPY, AUD/USD, and other major pairs will likely stick to broad trading ranges.
A key caveat is that ongoing bailout negotiations between Greece and its creditors threaten to cause turmoil across financial markets if both sides are unable to come to a last-minute funding agreement. In such a situation we would expect the safe-haven US Dollar to outperform alongside the Japanese Yen, while the Euro could fall sharply on Euro Zone-specific geopolitical stress.
Forex Volatility Prices Tumble after Big Week, but Greece Negotiations Represent Key Risk
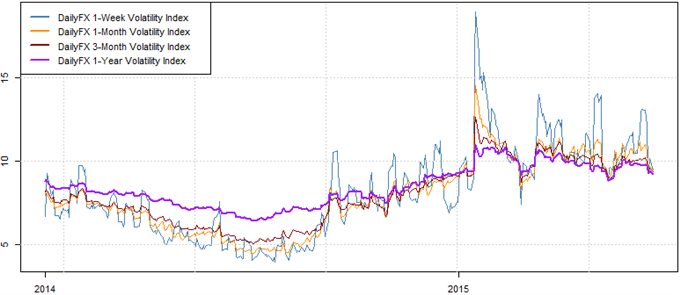
Data source: Bloomberg, DailyFX Calculations
Sign up for any future updates on market conditions via our e-mail distribution list.
The drop in volatility expectations shifts our focus away from our volatility-friendly Breakout2 trading system, and we are cautiously optimistic that the Momentum2 strategy may do well across a handful of faster-moving pairs.
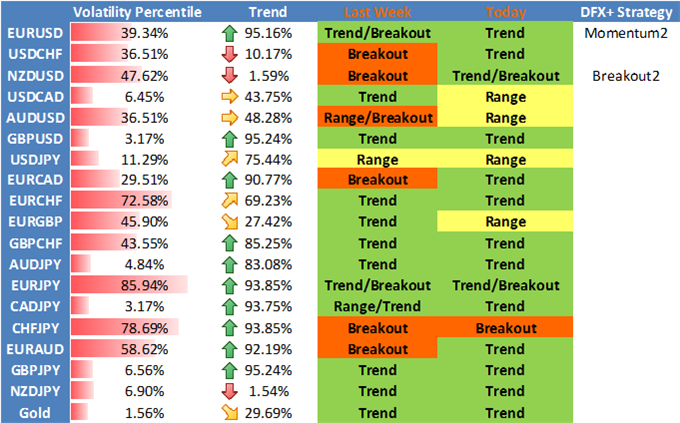
See below for our broader trading biases broken down by currency pair:
DailyFX Individual Currency Pair Conditions and Trading Strategy Bias
Understand the Breakout2 Trading System via our previous article
Auto trade the trend reversal-trading Momentum2system via our previous article.
Trade with strong trends via our Momentum1 Trading System
Use our counter-trend Range2 Trading system
--- Written by David Rodriguez, Quantitative Strategist for DailyFX.com
To receive the Speculative Sentiment Index and other reports from this author via e-mail, sign up to David’s e-mail distribution list via this link.
Contact David via Twitter at http://www.twitter.com/DRodriguezFX
Definitions
Volatility Percentile – The higher the number, the more likely we are to see strong movements in price. This number tells us where current implied volatility levels stand in relation to the past 90 days of trading. We have found that implied volatilities tend to remain very high or very low for extended periods of time. As such, it is helpful to know where the current implied volatility level stands in relation to its medium-term range.
Trend – This indicator measures trend intensity by telling us where price stands in relation to its 90 trading-day range. A very low number tells us that price is currently at or near 90-day lows, while a higher number tells us that we are near the highs. A value at or near 50 percent tells us that we are at the middle of the currency pair’s 90-day range.
Range High – 90-day closing high.
Range Low – 90-day closing low.
Last – Current market price.
Bias – Based on the above criteria, we assign the more likely profitable strategy for any given currency pair. A highly volatile currency pair (Volatility Percentile very high) suggests that we should look to use Breakout strategies. More moderate volatility levels and strong Trend values make Momentum trades more attractive, while the lowest Vol Percentile and Trend indicator figures make Range Trading the more attractive strategy.
HYPOTHETICAL PERFORMANCE RESULTS HAVE MANY INHERENT LIMITATIONS, SOME OF WHICH ARE DESCRIBED BELOW. NO REPRESENTATION IS BEING MADE THAT ANY ACCOUNT WILL OR IS LIKELY TO ACHIEVE PROFITS OR LOSSES SIMILAR TO THOSE SHOWN. IN FACT, THERE ARE FREQUENTLY SHARP DIFFERENCES BETWEEN HYPOTHETICAL PERFORMANCE RESULTS AND THE ACTUAL RESULTS SUBSEQUENTLY ACHIEVED BY ANY PARTICULAR TRADING PROGRAM.
ONE OF THE LIMITATIONS OF HYPOTHETICAL PERFORMANCE RESULTS IS THAT THEY ARE GENERALLY PREPARED WITH THE BENEFIT OF HINDSIGHT. IN ADDITION, HYPOTHETICAL TRADING DOES NOT INVOLVE FINANCIAL RISK, AND NO HYPOTHETICAL TRADING RECORD CAN COMPLETELY ACCOUNT FOR THE IMPACT OF FINANCIAL RISK IN ACTUAL TRADING. FOR EXAMPLE, THE ABILITY TO WITHSTAND LOSSES OR TO ADHERE TO A PARTICULAR TRADING PROGRAM IN SPITE OF TRADING LOSSES IS MATERIAL POINTS WHICH CAN ALSO ADVERSELY AFFECT ACTUAL TRADING RESULTS. THERE ARE NUMEROUS OTHER FACTORS RELATED TO THE MARKETS IN GENERAL OR TO THE IMPLEMENTATION.
OF ANY SPECIFIC TRADING PROGRAM WHICH CANNOT BE FULLY ACCOUNTED FOR IN THE PREPARATION OF HYPOTHETICAL PERFORMANCE RESULTS AND ALL OF WHICH CAN ADVERSELY AFFECT ACTUAL TRADING RESULTS.
Any opinions, news, research, analyses, prices, or other information contained on this website is provided as general market commentary, and does not constitute investment advice. The FXCM group will not accept liability for any loss or damage, including without limitation to, any loss of profit, which may arise directly or indirectly from use of or reliance contained in the trading signals, or in any accompanying chart analyses.
original source


