Talking Points:
- USD/JPY Technical Strategy: Price Channel & Lower-Highs Favor Resistance At ~110
- BoJ Keeping An Eye on “Excessive” JPY Strength, But No Word of Intervention
- Capital Demand Flows Help Point Way To Recent JPY Strength
To See How FXCM’s Live Clients Are Positioned In FX & Equities Click Here Now
Technical Overview:
Recently, we warned that a 300+ pip drop could develop on a break below support at 110.95/65 level. What now, of course, is the appropriate question after USD/JPY touched levels not seen since October 2014? In the most simplistic explanation, the chart continues to show us a series of lower-highs and lower-lows that favor a continuation of the downtrend that started unknowingly with the top on June 05. Since then, the US Dollar has fallen against the JPY by ~14.5%, and aside from Bank of Japan intervention, there seems to be little stopping this move from continuing. In recent weeks, we have seen the Fed seem content to keep a lid on US Dollar strength, and the JPY remains strong even with many global stock indices that are typically inversely correlated with the JPY sitting near YTD highs.
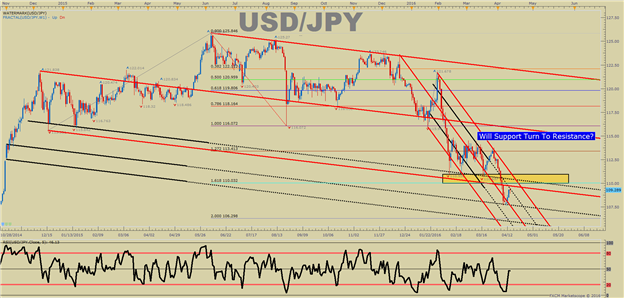
On the chart above, you can see a key question that is appropriate to ask at such a time as this. In short, will prior chart support turn to resistance? While the JPY has weakened a little over 1% against the US dollar, the bigger picture of a sustained downtrend seems intact. Thursday’s move was a paltry 67 pips, which also helps show that there isn’t a rush of buyers bidding up USD/JPY. This lack of buying the lows likely indicate the frustration of no-upside lately, and could hint that traders are waiting for central banks to force them into the position as they have in the past instead of jumping in front of a potential steamroller.
Fundamental Story:
Not only are doubts rising about the efficacy of Abenomics, but foreigners are buying Japanese Government Bonds to the tune of ¥18.3 trillion’s worth of Japanese government bonds net in February, according to the Japan Securities Dealers Association. This rise in buying could mean that capital flow is bidding up the JPY in an unexpected fashion given the negative interest rate announcement on January 29.
Also, indicative of this flight to safety via JPY denominated financial instruments is Gold demand in Japan. Japan’s largest bullion retailer, Tanaka Kikinzoku Kogyo K.K., noted that sales of Gold Bars have climbed 35% in Q1 vs. the same period in 2015. JPY & Gold demand tend to go hand-in-hand, which may be indicative of building up demand to be long JPY and Gold.
Understandably, the recent JPY strength may be leaving traders wondering why there has been little intervention given the historical precedence set by the BoJ of acting quick and answering questions later. Whether or not there is intervention an appropriate question to ask, but it may be helpful to understand that Japan is hosting the G7 in May. Therefore, blatant intervention may be doubtful as it would put other countries in the G7 at a distinct competitive disadvantage.
Sentiment:
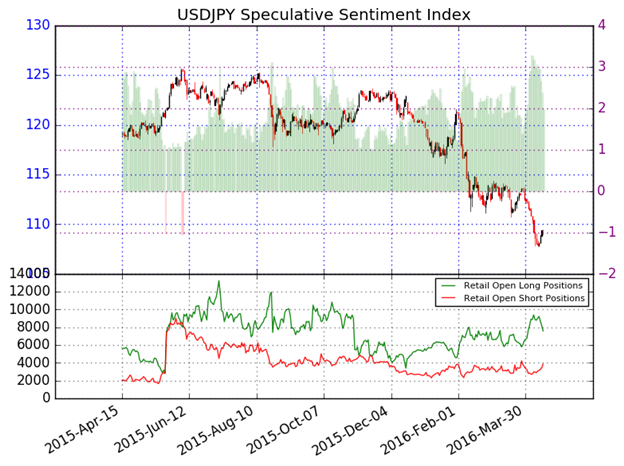
The ratio of long to short positions in the USDJPY stands at 1.96 as 66% of traders are long. Yesterday the ratio was 2.38; 70% of open positions were long. Short positions are 14.4% higher than yesterday and 30.4% above levels seen last week. Open interest is 0.1% higher than yesterday and 8.2% above its monthly average. We use our SSI as a contrarian indicator to price action, and the fact that the majority of traders are long gives signal that the USDJPY may continue lower. The trading crowd has grown less net-long from yesterday and last week. This reduction of long positions favors a retracement towards support within the overall downtrend.
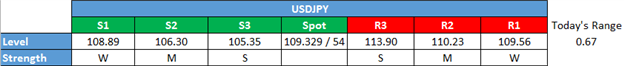
Key Levels As Of Wednesday, April 14, 2016
Interested In Learning the Traits of FXCM’s Successful Traders? If So, Click Here
T.Y.
original source


