- EURUSD weekly key reversal at 52 week average
- GBPUSD false bullish break is…bearish
- USDJPY drops into long term moving average…and pops
--Subscribe to Jamie Saettele's distribution list in order to receive a free report to your inbox several times a week.
--For more analysis and trade setups (including current positions and the ‘watchlist’), visit SB Trade Desk
EUR/USD
Weekly
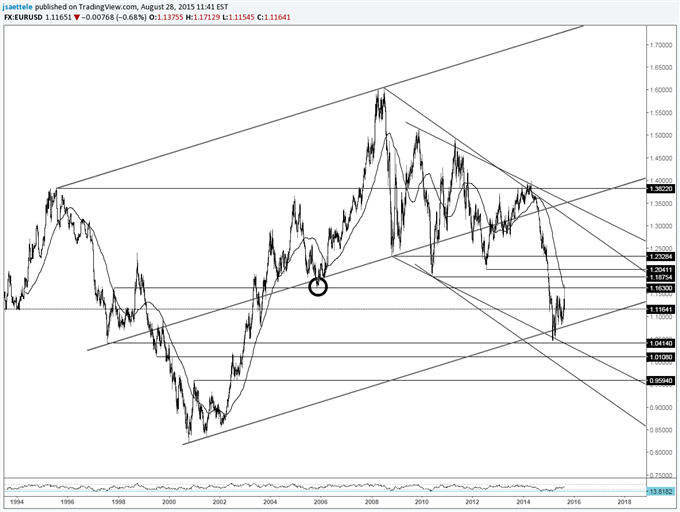
Chart Prepared by Jamie Saettele, CMT
Automate trades with Mirror Trader
-“EURUSD continues to hold up at the line that extends off of the 2000 and 2001 lows. The slope of this line is similar to the slope of the line that connects the 1995 (synthetic rate) and 2008 highs. A parallel extended from the 2000 low creates a channel so don’t dismiss resistance breaks on the daily (from long term support). Above 1.1050 signals that the long side is viable towards the top of the multi-month range.”
-“EURUSD faces a big test from the top of the range and 200 DMA. A breakout would target 1.1811-1.2086.” The rate broke out Monday but failed to extend higher and the weekly chart is left with a nasty bearish reversal candle at the 52 week average. Is this how the broader decline resumes or is a wider period of range activity in order? The latter seems more likely given the presence of the mentioned long term trendline support.
GBP/USD
Weekly
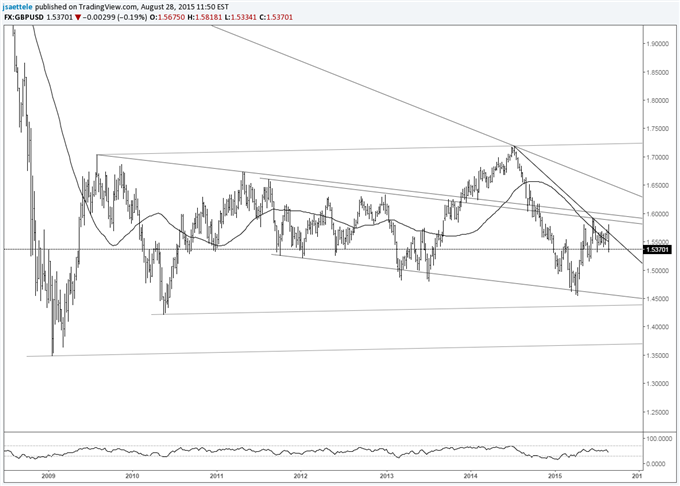
Chart Prepared by Jamie Saettele, CMT
Automate trades with Mirror Trader
-This week’s action engulfs the prior 6 weeks and may set the stage for a test of 1.4500 given the false break above the line that extends off of the 2014 and 2015 highs. The false breakout took place at the 52 week average, which is downward sloping and gives credence to a long term bearish view.
AUD/USD
Weekly
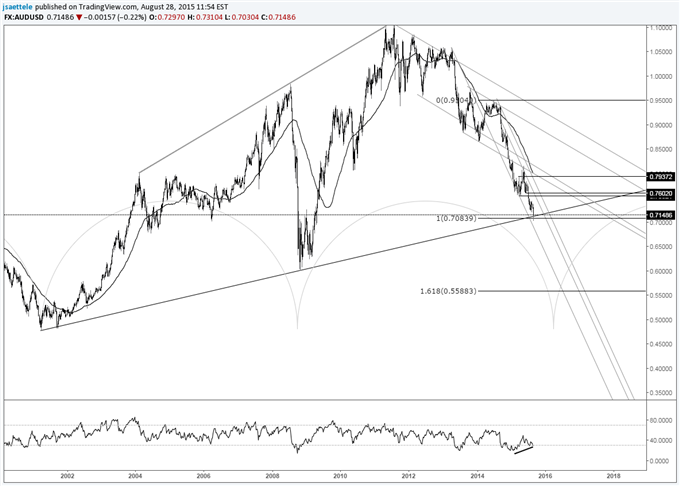
Chart Prepared by Jamie Saettele, CMT
Automate trades with Mirror Trader
-“A slope confluence pinpointed the May high, which keeps the broader trend pointed lower. A long term level to be aware of in AUDUSD is the line that connects the 2001 and 2008 lows, which is near .7100.”
-“The immediate picture is bearish. Range expansion objectives yield .7143 and .6902.” The former level is joined by the trendline that extends off of the 2001 and 2008 lows. The decline from the 2011 high would consist of 2 equal legs (subdivided with the 2013 low and 2014 high) at .7084. Exceeding .7450 would indicate a change in behavior for Aussie and point towards longer term downtrend resistance in the high .7600s. Outside day reversals and volume considerations do point to capitulation.
NZD/USD
Weekly
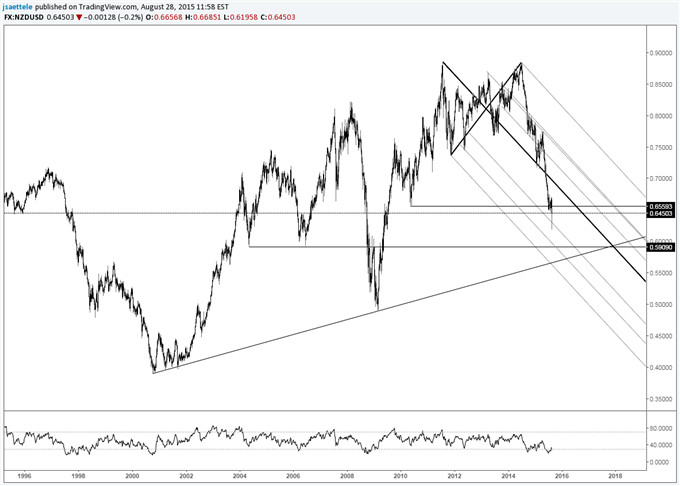
Chart Prepared by Jamie Saettele, CMT
Automate trades with Mirror Trader
-“One can’t help but notice that an epic double top is possible with a target of .5898. That would trigger on a drop below .7370.”
-“A bearish wedge pattern has formed and yields an objective of .6607.” Look towards the mentioned objectives (.6607 and .5898). The wedge objective has been reached as has the 2010 low at .6560. The next levels to be aware of are .64 (61.8% retracement of the 2009-2011 rally and 50% retracement of the 2000-2011 rally) and .60 (long term double top target).
USD/JPY
Weekly
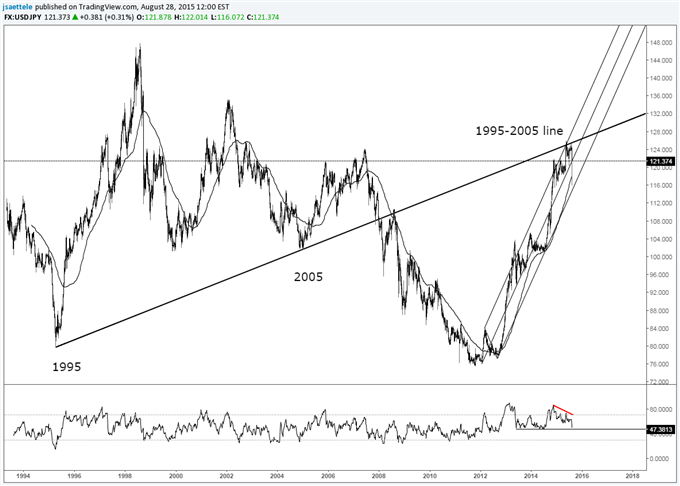
Chart Prepared by Jamie Saettele, CMT
Automate trades with Mirror Trader
-“June’s trade produced a monthly key reversal in USDJPY.” USDJPY has snapped back but a break above the long term resistance confluence (uptrend resistance and the line from the 1995 and 2005 highs) is still needed in order to minimize downside risk.”
-“Weakness below 123 has triggered a failed short term bullish pattern and consequently a bearish signal. Given where USDJPY is declining from (significant long term resistance), this decline could be precipitous.” Precipitous indeed. The rate reached (crashed into) the 52 week average for the first time since July 2014 and weekly RSI has corrected to 50. Both technical considerations are consistent with eventual resumption of the long term bull trend but the presence of the 1995-2005 trendline remains an impediment to the bull case.
USD/CAD
Weekly
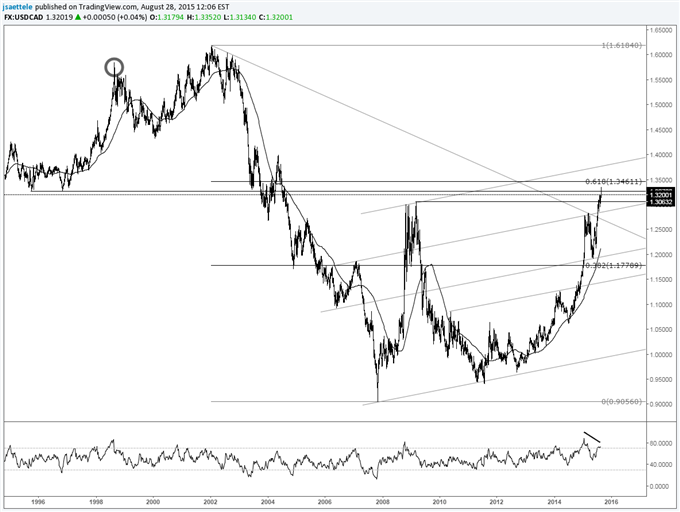
Chart Prepared by Jamie Saettele, CMT
Automate trades with Mirror Trader
-“A 10 month trendline has supported USDCAD on recent dips. The development indicates potential for resumption of the broader bull move.”
-“USDCAD has broken out. 11 year highs aren’t far off. The 2009 high is at 1.3062 (just below the 127.2% extension of the March-May range, which is at 1.3083).” 11 year highs have been reached. The next measured level is the 161.8% extension of the March-May range at 1.3399. The March high at 1.2834 is now support.
USD/CHF
Weekly
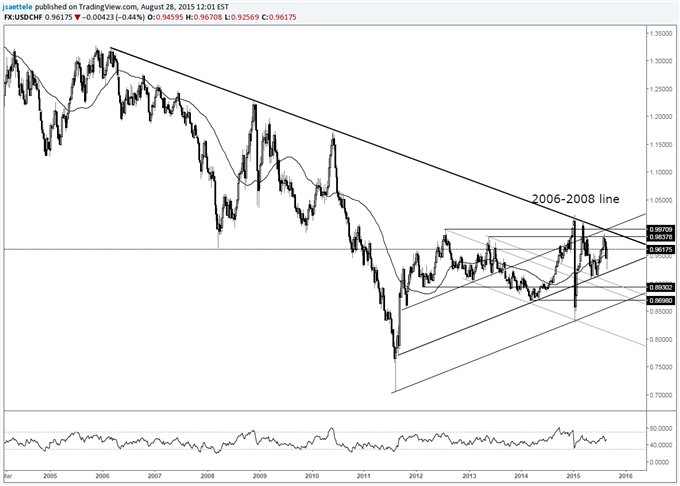
Chart Prepared by Jamie Saettele, CMT
Automate trades with Mirror Trader
-“USDCHF traded to its best level since March this week and formed a weekly key reversal. This action serves as a warning to bulls that the rally from May is nearing completion. Major resistance is seen slightly higher from the 14 year trendline and 2012 high of .9971 over the next few weeks but the USDCHF top this week was right at the 78.6% retracement of the March-May decline.”
-The break below .9656 strongly suggests that a top of some important is in place. Support may come in near .92 (slope line).
original source


