- EURUSD and USDCHF divergence still casts a cloud
- USDJPY Elliott channel in focus
- GBPUSD reaction zone at 1.6690-1.6750
--Subscribe to Jamie Saettele's distribution list in order to receive a free report to your inbox thrice a week.
--Tradingideas are availabletoJ.S. Trade Desk members.
EUR/USD
Weekly
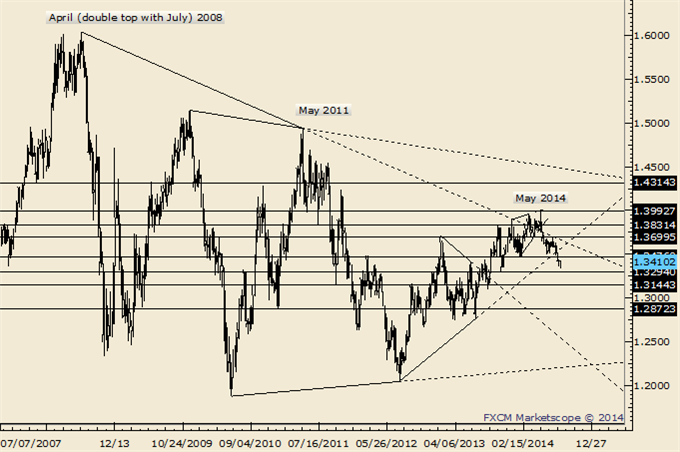
Chart Prepared by Jamie Saettele, CMT using Marketscope 2.0
Automate trades with Mirror Trader
-“Long term, a failed breakout and top would keep with the pattern of 3 year cycle tops. 1.3750 is an important reference point (year open).”
-The break of 1.3476 completed a topping process with targets of 1.3294 (origin of diagonal), 1.3209 (2 equal legs), and 1.3012 (head and shoulders target). 1.3476-1.3512 is now resistance and 1.3550 is important to the integrity of the identified bear trend.
GBP/USD
Weekly
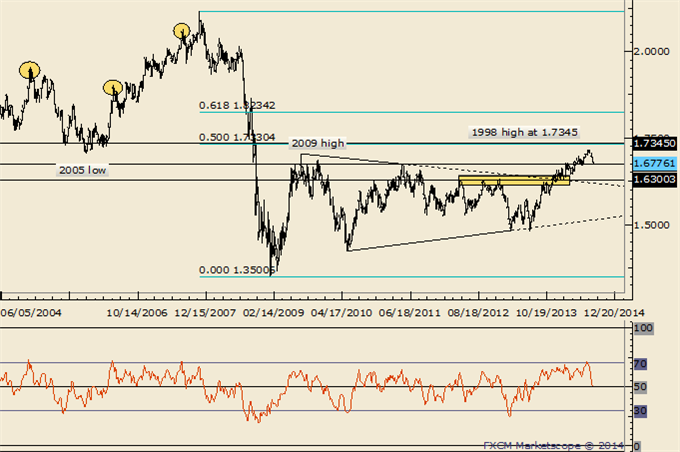
Chart Prepared by Jamie Saettele, CMT using Marketscope 2.0
Automate trades with Mirror Trader
-“Of note is a weekly outside reversal and weekly RSI rolling over from above 70 this week. Prior instances of RSI rolling over (2004, 2006, and 2007) from above 70 indicated tops of at least several months.”
-Be aware that GBPUSD has reached possible ‘momentum support’ from the 50 level in RSI (weekly), and is nearing possible price supports from the 2011 high at 1.6745 and May low at 1.6692. Major support would come in from the 3 peaks in 2012 and this year’s low at 1.6250-1.6340.
AUD/USD
Weekly
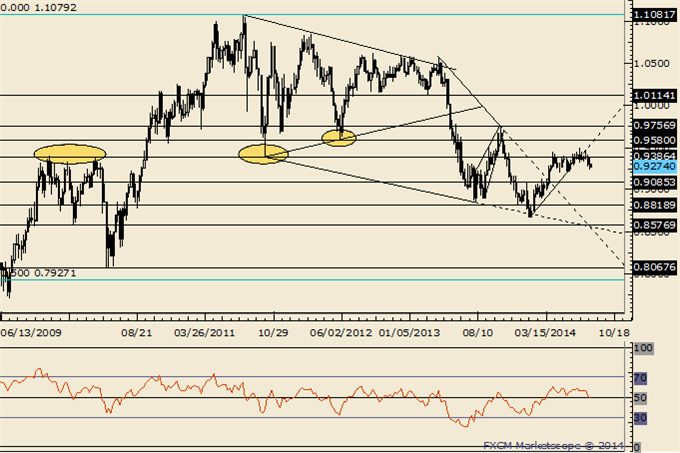
Chart Prepared by Jamie Saettele, CMT using Marketscope 2.0
Automate trades with Mirror Trader
-“The combination of the .9400 figure and weekly RSI failing near 60 indicates a lot of overhead to punch through. Since the 2011 top, each RSI failure near 60 has led to a top or topping process (range for several weeks then a breakdown...that may be the case now).”
-The May low and 200 DMA at .9200 is critical to the integrity of the uptrend.
NZD/USD
Monthly
Chart Prepared by Jamie Saettele, CMT using Marketscope 2.0
Automate trades with Mirror Trader
-“Don’t forget about the line that extends off of the 1996 and 2007 highs. That line crosses through the 2008, 2011, and highs as well. In 2011 (record free float high), the rate surged through the line in late July before topping on August 1st. The rate reversed this week from pips below the record high and above the mentioned line.”
-NZDUSD weakness from the July high is impulsive, which suggests that an important high is in place. 5 waves down also warn of a rally attempt. The current level, defined by the 200 DMA and trendline support, is a good place for that rally attempt to take place. Above .8500 is needed in order to suggest that the minor low is in place.
USD/JPY
Weekly
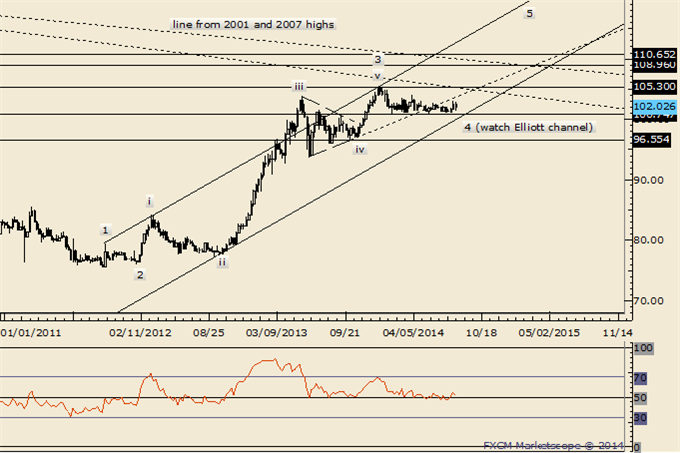
Chart Prepared by Jamie Saettele, CMT using Marketscope 2.0
Automate trades with Mirror Trader
-The miserable trading conditions in USDJPY are probably explained by its long term Elliott wave position. That is, the rate has been mired in a corrective 4th wave all year. The good news is that wave 4 probably ends soon. Keep focused on the Elliott channel. The line crosses from about 100 to 100.75 for the remainder of August.
USD/CAD
Weekly
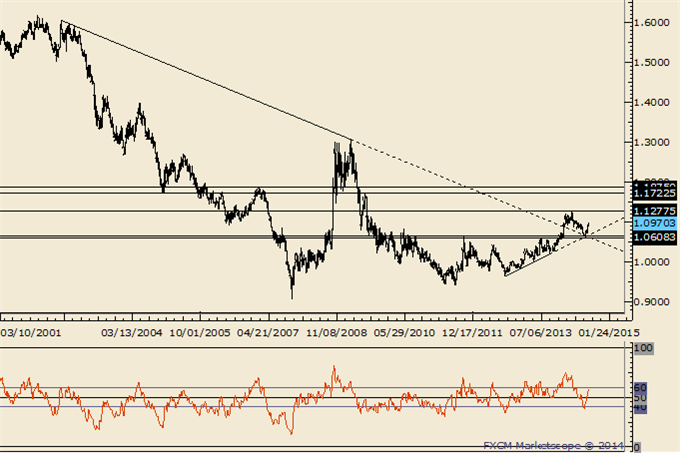
Chart Prepared by Jamie Saettele, CMT using Marketscope 2.0
Automate trades with Mirror Trader
-“USDCAD has fallen apart which ironically means it is probably going to find some sort of low soon. The rate is nearing important price levels. The 2011 high at 1.0657 and current year open at 1.0634 are possible supports. The line that extends off of the 2012 and September 2013 lows is at about 1.0607 next week. This level is in line with the July 2013 high at 1.0608.” USDCAD ended up finding low at 1.0620.
-The USDCAD advance from the July low is impulsive and may find resistance near 1.1025/50 (61.8% and June high) before correcting lower.
USD/CHF
Weekly
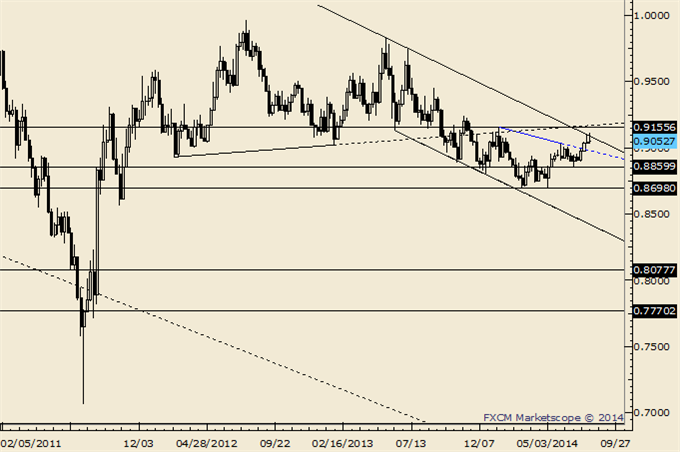
Chart Prepared by Jamie Saettele, CMT using Marketscope 2.0
Automate trades with Mirror Trader
-A divergence remains in place with regards to EURUSD and USDCHF (USDCHF < YTD high while EURUSD is at its YTD low), which casts a cloud over the broader USD advance. USDCHF has also traded into and pulled back from channel resistance. .8970 is support and needs to hold in order to look higher.
original source


