Talking Points
- NZD/USD Technical Strategy: Sidelines Preferred
- Haramifails to find confirmation leaving bullish signals lacking
- Break of 0.8650/70 required to set the stage for a drop to 0.8500
NZD/USD continues to tease traders at critical support near 0.8650/70 with an absence of bullish candlesticks casting doubt on a bounce. While the Harami pattern looked promising as a potential reversal signal, it failed to find confirmation from a successive up-day. Given the close proximity to buying support, a break lower would be preferred before suggesting short positions.
NZD/USD: Awaiting Break Below Key Support
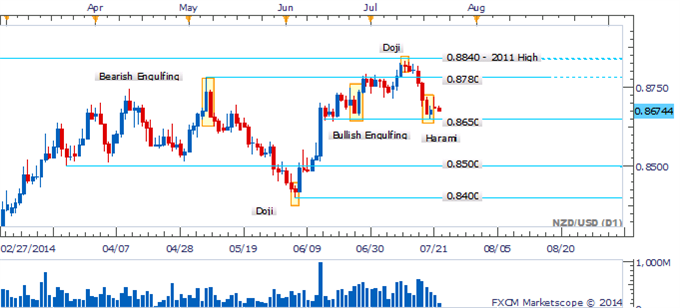
Daily Chart - Created Using FXCM Marketscope 2.0, Volume Indicator Available Here
A Bearish Engulfingpattern on the four timeframe chart warned of intraday weakness for the Kiwi following a failure to breach the 0.8720 mark. Similarly, to the daily chart reversal signals are lacking at this point, which makes a recovery over the session ahead questionable.
NZD/USD: Bearish Engulfing Pattern Offered Early Warning
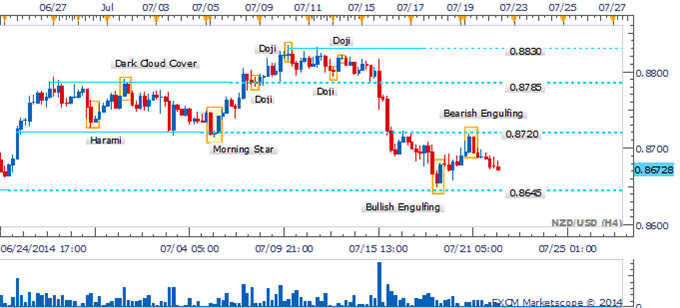
Four Hour Chart - Created Using FXCM Marketscope 2.0, Volume Indicator Available Here
By David de Ferranti, Currency Analyst, DailyFX
Follow David on Twitter: @Davidde
To receive David’s analysis directly via email, please sign up here.
Learn how to read candlesticks to help identify trading opportunities with the DailyFX Candlesticks Video Course.
original source


