To receive Ilya's analysis directly via email, please SIGN UP HERE
Talking Points:
- NZD/USD Technical Strategy: Flat
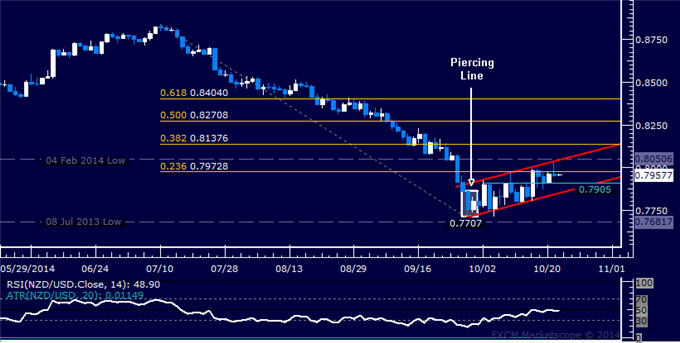
- Support: 0.7905, 0.7849, 0.7682
- Resistance:0.7973, 0.8051, 0.8138
The New Zealand Dollar advanced as expected against its US namesake after prices forming a bullish Piercing Line candlestick pattern. Near-term resistance is at 0.7973, the 23.6% Fibonacci retracement, with a break above that on a daily closing basis exposing the intersection of a rising channel top and the February 4 low at 0.8051. Alternatively, a turn below resistance-turned-support at 0.7905 clears the way for a challenge of the channel floor at 0.7849.
Prices are wedged too closely between near-term support and resistance levels to justify a trade on the long or short side from a risk/reward perspective. We will remain on the sidelines, waiting for a more compelling opportunity to emerge.
Add these technical levels directly to your charts with our Support/Resistance Wizard app!
Daily Chart - Created Using FXCM Marketscope 2.0
--- Written by Ilya Spivak, Currency Strategist for DailyFX.com
original source


