Talking Points:
- NZD/USD Retail Crowd Remains Net-Long Ahead of RBNZ Financial Stability Report.
- USDOLLAR .
Avoid the pitfalls of trading by steering clear of classic mistakes. Review these principles in the "Traits of Successful Traders" series.
NZD/USD
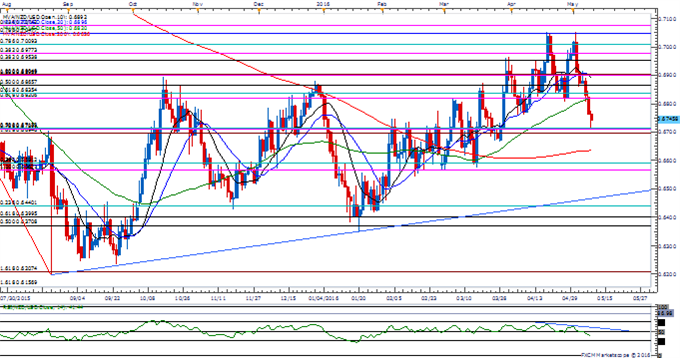
Chart - Created Using FXCM Marketscope 2.0
- NZD/USD may continue to carve a series of lower highs & lows as there appears to be a near-term double-top formation accompanied by a bearish tilt in the Relative Strength Index (RSI).
- With the Reserve Bank of New Zealand (RBNZ) scheduled to release its Financial Stability report on Wednesday, a greater willingness by Governor Graeme Wheeler to further support the real economy may dampen the appeal of the kiwi as the central bank continues to embark on its easing cycle in 2016.
- NZD/USD has come up against a near-term hurdle around 0.6690 (161.8% expansion) to 0.6710 (50% retracement), with a break/close below opening up the next downside target around 0.6570 (100% expansion) to 0.6590 (38.2% retracement).
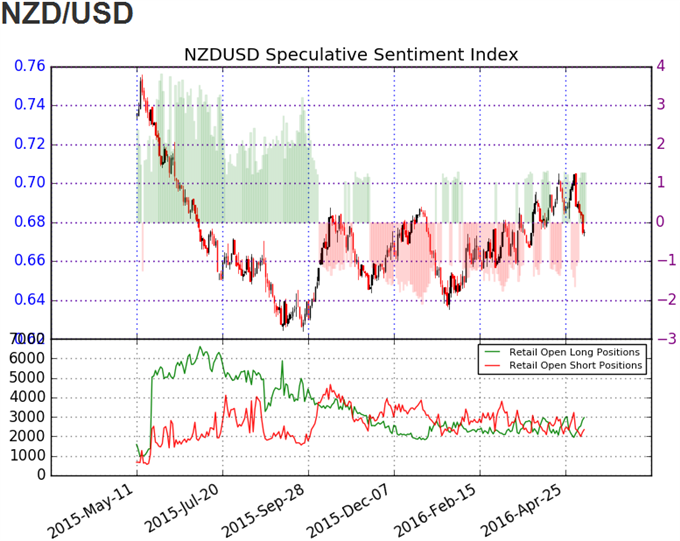
- The DailyFX Speculative Sentiment Index (SSI) shows the FX crowd remains net-long NZD/USD since May 5, with the ratio approaching near-term extremes as it climbs towards +1.50.
- The ratio currently stands at +1.34 as 57% of traders are long, with long positions 52.0% higher from the previous week, while open interest stands 3.9% above the monthly average.
Why and how do we use the SSI in trading? View our video and download the free indicator here
USDOLLAR(Ticker: USDollar):
Index | Last | High | Low | Daily Change (%) | Daily Range (% of ATR) |
DJ-FXCM Dollar Index | 11897.97 | 11910.96 | 11880.76 | 0.00 | 51.04% |
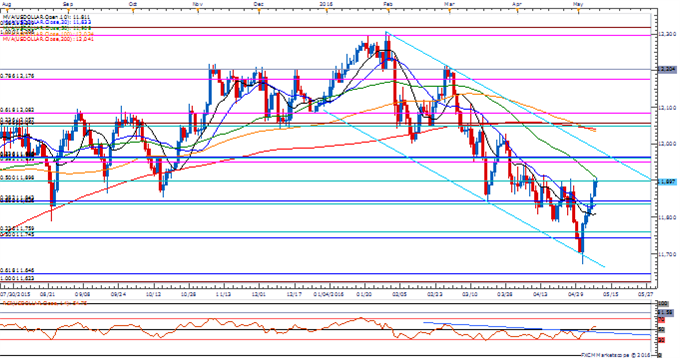
Chart - Created Using FXCM Marketscope 2.0
- Even though the USDOLLAR struggles to retain the gains from the early morning trade, the greenback may mount a larger recovery amid the ongoing series of higher highs & lows; long-term outlook remains tilted to the downside as it preserves the descending channel formation from earlier this year.
- Despite the slew of better-than-expected data prints from earlier this morning, Fed Fund Futures are showing a less than 10% probability for a June Fed rate-hike as Chair Janet Yellen appears to be in no rush to further normalize monetary policy.
- Still waiting for a closing price above 11,898 (50% retracement) to look for move towards the top of the channel, which coincide with the next region of interest around 11,951 (38.2% expansion) to 11,965 (23.6% retracement).
Click Here for the DailyFX Calendar
Get our top trading opportunities of 2016 HERE
Read More:
Record Trend Following Long Position in Gold
AUD/CAD Into Key Support- Monthly Opening Range In Focus
US Dollar Bear Trap within an Even Bigger Bull Trap?!
USD/JPY Technical Analysis: Has It Bottomed?
--- Written by David Song, Currency Analyst
To contact David, e-mail dsong@dailyfx.com. Follow me on Twitter at @DavidJSong.
To be added to David's e-mail distribution list, please follow this link.
original source


