The March 2018 Investor Movement Index® hit its lowest point in nearly two years, dropping 12 percent from the month prior to 5.22, TD Ameritrade, Inc.1 announced today. The Investor Movement Index, or the IMXSM, is a proprietary, behavior-based index created by TD Ameritrade that aggregates Main Street investor positions and activity to measure what investors actually were doing and how they were positioned in the markets.
This press release features multimedia. View the full release here: https://www.businesswire.com/news/home/20180409005772/en/
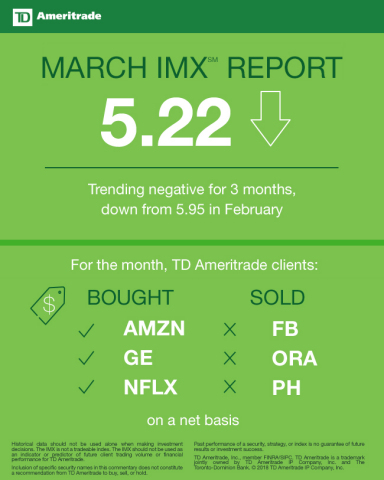
TD Ameritrade March 2018 Investor Movement Index (Graphic: TD Ameritrade)
March IMX
The March 2018 Investor Movement Index for the four weeks ending March 30, 2018, reveals:
- Reading: 5.22 (compared to 5.95 in February)
- Trend direction: Negative
- Trend length: 3 month
- Score relative to historic ranges: Moderately Low
As volatility shook up the market, TD Ameritrade clients seemed to display optimism in the state of the economy by continuing net buying activity in March. Despite being net buyers, client accounts experienced reduced exposure to equity markets as relative volatility in widely held names, including Amazon Inc. (AMZN) and General Electric Co. (GE), decreased during the month.
“March’s market sell-off continued with news of a potential trade war between the U.S. and China, followed by a data breach involving Facebook that impacted millions of users,” said JJ Kinahan, chief market strategist at TD Ameritrade. “Clients navigated the markets by dialing back exposure and rotating out of popular stocks - such as Facebook - which has been a primary holding for many clients including millennials.”
TD Ameritrade clients bought the market on the dip in March. Top net buys included:
- Amazon Inc. (AMZN) and Netflix Inc. (NFLX), both of which ended the month down more than 15 percent.
- General Electric Co. (GE), as shares fell below $13 for the first time since 2009.
- Exxon Mobil Corp. (XOM), as oil prices reached the highest levels since early February.
- Intel Corp. (INTC), which traded higher during the month following reports of a possible takeover of Broadcom.
- Boeing (BA), which reached an all-time high early in the period then traded lower on fears of a trade war.
Despite being net buyers, TD Ameritrade clients found equities to sell during the period, including:
- Facebook, Inc. (FB), which was down nearly 25 percent in March from yearly highs following concerns of data privacy.
- Parker-Hannifin Corp. (PH), following a lower analyst price target and subsequent stock selloff.
- WYNN Resorts, Limited (WYNN), after the stock traded higher following the embattled co-founder and former CEO, Steve Wynn, selling his stake in the company.
- Western Digital Corp. (WDC), following an analyst upgrade.
While market indices stabilized at the start of April, ongoing news about tariff threats continued to drive market volatility. As investors figure out how to position themselves for the rest of April, they will look for guidance from corporate earnings. In particular, earnings conference calls will be a focus as CEOs share their input on the economy and consumer demand.
“Based on geopolitical statements, there is no reason to believe that volatility will significantly stop throughout the next month given the time frames on tariffs,” said JJ Kinahan, chief market strategist at TD Ameritrade. “We will most likely not see any certainty out of what will actually be implemented until well after April.”
About the IMX
The IMX value is calculated based on a complex proprietary formula. Each month, TD Ameritrade pulls a sample from its client base of 11 million funded accounts, which includes all accounts that completed a trade in the past month. The holdings and positions of this statistically significant sample are evaluated to calculate individual scores, and the median of those scores represents the monthly IMX.
For more information on the Investor Movement Index, including historical IMX data going back to December 2010; to view the full report from March 2018; or to sign up for future IMX news alerts, please visit www.tdameritrade.com/IMX. Additionally, TD Ameritrade clients can chart the IMX using the symbol $IMX in either the thinkorswim® or TD Ameritrade Mobile Trader platforms.
Inclusion of specific security names in this commentary does not constitute a recommendation from TD Ameritrade to buy, sell, or hold.
Past performance of a security, strategy, or index is no guarantee of future results or investment success.
Historical data should not be used alone when making investment decisions. Please consult other sources of information and consider your individual financial position and goals before making an independent investment decision.
The IMX is not a tradable index. The IMX should not be used as an indicator or predictor of future client trading volume or financial performance for TD Ameritrade.
For the latest TD Ameritrade news and information, follow the company on Twitter, @TDAmeritradePR.
Source: TD Ameritrade Holding Corporation
About TD Ameritrade Holding Corporation
Millions of
investors and independent registered investment advisors (RIAs) have
turned to TD Ameritrade’s (Nasdaq: AMTD) technology, people and
education to help make investing and trading easier to understand and
do. Online or over the phone. In a branch or with an independent RIA.
First-timer or sophisticated trader. Our clients want to take control,
and we help them decide how — bringing Wall Street to Main Street for
more than 40 years. TD Ameritrade has time and again been recognized as
a leader in investment services. Please visit TD Ameritrade’s newsroom
or www.amtd.com
for more information.
Brokerage services provided by TD Ameritrade, Inc., member FINRA (www.FINRA.org)/SIPC (www.SIPC.org).
View source version on businesswire.com: https://www.businesswire.com/news/home/20180409005772/en/
