Talking Points:
- GBP/USD trading around the big figure at 1.30
- A quiet economic docket puts the focus on UK data for possible Brexit related volatility
- GSI is a powerful big data indicator that can help you determine whether short-term trends will continue or reverse
The GBP/USD is trading lower, currently under 1.30 after the pair fell overnight following BOE’s Ian McCafferty remarks suggesting that “more easing is likely to be required” by the central bank.
The Brexit fallout might once again be in focus today as UK data headlines a quiet economic docket.
Against this backdrop we will form our outlook and look to find short term trading opportunities using the Grid Sight Index (GSI) indicator.
Click Here for the DailyFX Calendar
UK’s growth outlook might be back in focus today as a number of “second tier” UK economic indicators are set to hit the wires.
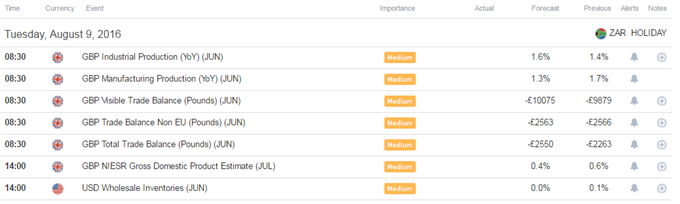
Visible Trade Balance, which does not record intangibles like services (reporting only on physical goods) is expected to print a larger deficit of -10.075B (GBP) in June, versus the prior -9.879B (GBP) print.
The June’s Manufacturing Production figures, which account for approximately 80% of overall industrial production, are set to show manufacturing output eased to 1.3% from the prior 1.7% print.
Signs of strong output in June and reduced deficit could potentially go against the preliminary 2Q’16 UK GDP estimates in which the Office for National Statistics (ONS) indicated that growth was boosted by the strong industrial output figures, and services which were mainly in April, and were little changed over the following two months (including June), perhaps indicative of pre-Brexit worries.
This could set the stage nicely and hint at July’s NIESR GDP estimates later today, which is expected to show growth eased in the three months to July to 0.4% from the 0.6% growth in the months leading to June.
The NIESR estimate echoed the ONS in this last report saying growth stagnated in May and contrasted in June, but was not enough to offset the very strong April numbers.
This might imply that now that April drops from the NIESR estimate, the figure could potentially show a deterioration of growth.
This could provide a hint at things to come with a preview of post-Brexit economic conditions.
Against the backdrop of BOE’s Ian McCafferty suggesting that “more easing is likely to be required” by the central bank following the BOE’s “bazooka” last week, today’s figures could potentially be indicative of a larger macro theme and perhaps even prove market moving in the short-term.
GBP/USD 5-Min GSI Chart: August 9, 2016
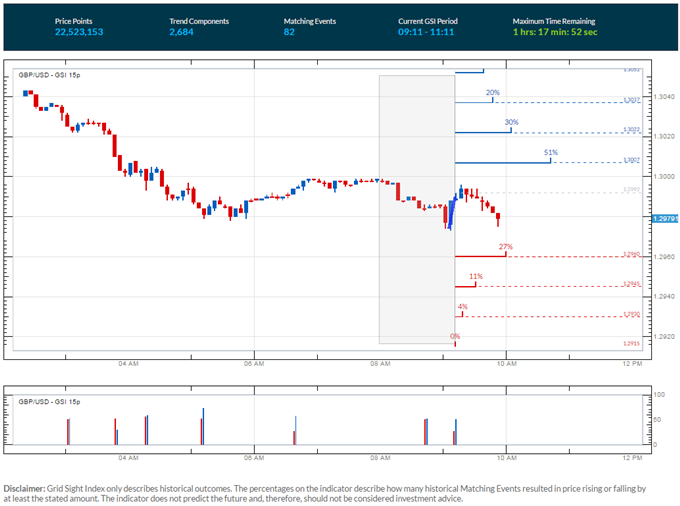
The GBP/USD is trading below the 1.30 level at the time of writing, with GSI calculating significantly higher percentage of past movement to the upside in the short term. The GSI indicator above calculates the distribution of past event outcomes given certain momentum patterns, and can give you a look at the market in a way that's never been possible before, analyzing millions of historical prices in real time. By matching events in the past, GSI describes how often the price moved in a certain direction.
You can learn more about the GSI here.
GBP/USD Technical Levels:

Click here for the DailyFX Support & Resistance tool
We use volatility measures as a way to better fit our strategy to market conditions. The British Pound is still expected to be the most volatile currency versus the US Dollar on a 1-Week implied volatility basis. In turn, this could imply that breakout type trades might be preferable in the short term.
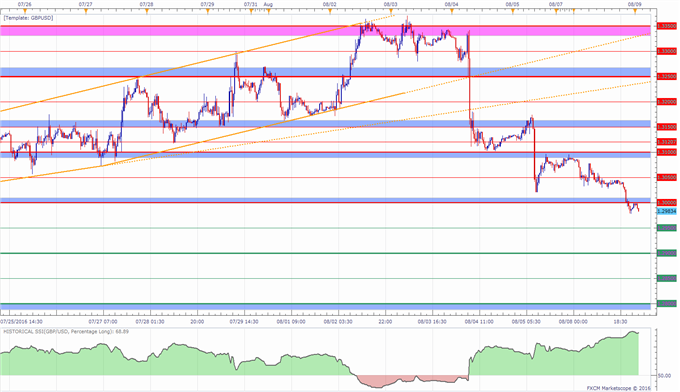
GBP/USD 30-Min Chart: August 9, 2016
(Click to Enlarge)
The GBP/USD is currently trading below the 1.30 handle. The technical areas appear quite clean to either side with areas of resistance and support around the 00s and 50s (see chart above for specifics).
When price reaches those levels, short term traders might use the GSI to view how prices reacted in the past given a certain momentum pattern, and see the distribution of historical outcomes in which the price reversed or continued in the same direction.
We generally want to see GSI with the historical patterns significantly shifted in one direction, which could potentially be used with a pre-determined bias and other technical tools.
A common way to use GSI is to help you fade tops and bottoms, and trade breakouts. That’s why traders may want to use the GSI indicator when price reaches those specific pre-determined levels, and fit a strategy that can offer a proper way to define risk. We studied over 43 million real trades and found that traders who do that were three times more likely to turn a profit. Read more on the “Traits of Successful Traders” research.
Meanwhile, the DailyFX Speculative Sentiment Index (SSI) is showing that about 68.9% of FXCM’s traders are long the GBP/USD at the time of writing, apperantly trying to pick a bottom. The SSI is mainly used as a contrarian indicator implying further weakness ahead.
You can find more info about the DailyFX SSI indicator here
--- Written by Oded Shimoni, Junior Currency Analyst for DailyFX.com
To contact Oded Shimoni, e-mail oshimoni@dailyfx.com
Follow him on Twitter at @OdedShimoni
original source

