Talking Points
-GBP/USD bounced from a 31 year common retracement zone
-Sentiment and volume point towards additional losses
-1.3118 is a key level that bears will want to watch
Cable continues to trade heavy in the wake of the Brexit vote. GBP/USD resistance levels continue to hold with sentiment and volume measures pointing towards more losses.
The low from yesterday at 1.2788 is an important low. From a multi-decade perspective, it rests at a 78.6% retracement level of the 1985 low to the 2007 high. Though it may be formidable support, a break below that level opens the door to much lower levels like 1.2450 and possibly even 1.1750.
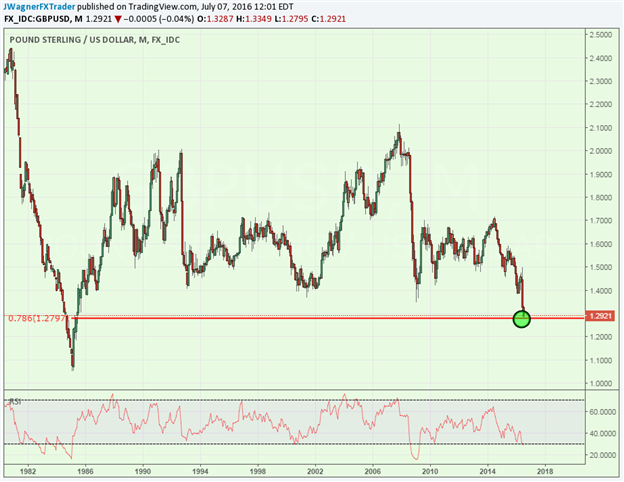
If GBP/USD musters up some energy to rally, a key level to watch to the upside is the June 27 low of 1.3118. Staying below this level suggests the down trend is strongly in force. Above 1.3118, the door is open to a stronger rally.
When looking at pair through sentiment, the trend remains towards lower levels. Sentiment, as measured through FXCM’s Speculative Sentiment Index (SSI) has softened a bit, nearly 65% of traders are still positioned to the long side as they try to pick a bottom in the pair. Long positions are pressing a 3 month high and are 29% above levels seen last week. Short interest is picking up some, but is still a minority compared to the bottom pickers. The current SSI reading is +1.93. If the SSI reading continues near current levels or if it increases, that signals the potential for further losses. Follow SSI in real time here.
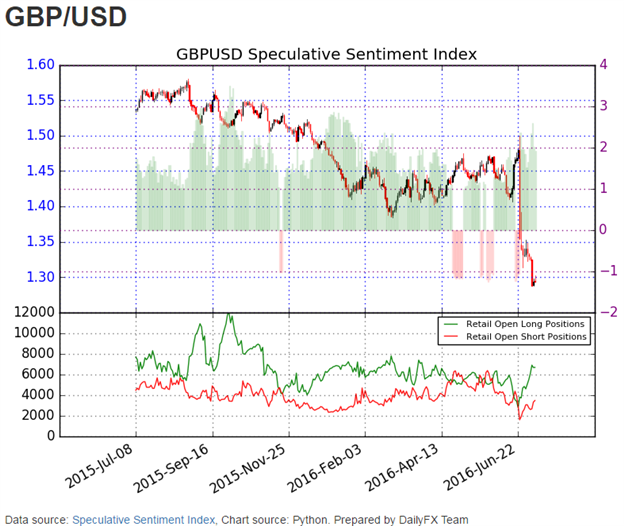
From the image above, you can see that traders were bullish for the most part over the past 12 months (green shaded area). During that time span, the GBP/USD exchange rate has dropped from 1.55 to current levels. This illustrates the power behind an indicator like SSI.
Created using FXCM's Trading Station charts
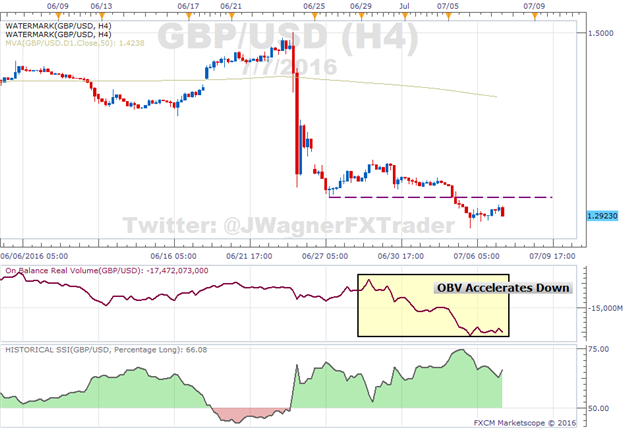
Volume is suggesting lower levels as well. Volume, as measured through On Balance Volume (OBV), is well below previous swing lows which is confirming the break down in price. That is to say, more volume is occurring as price is falling relative to the volume when price is rising.
Bottom line, a break down below 1.2788 or above 1.3118 dictates the next near term trend.
It is important to note that Friday morning the US jobs report is being released. This is expected to bring some volatility and illiquid trading in the moments leading up to and just after the release. Therefore, gap risk is high going into the event.
Having trouble trading GBP/USD? This may be why.
Interested in a quarterly outlook for GBP and/or USD? Download our quarterly forecast here.
---Written by Jeremy Wagner, Head Trading Instructor, DailyFX EDU
Follow me on Twitter at @JWagnerFXTrader .
See Jeremy’s recent articles at his Bio Page.
To receive additional articles from Jeremy via email, join Jeremy’s distribution list.
Check out the latest standings for the FXCM trading contest HERE.
original source

